29
/
en
AIzaSyAYiBZKx7MnpbEhh9jyipgxe19OcubqV5w
April 1, 2024
126048
El Salvador
SLV
true
2
1
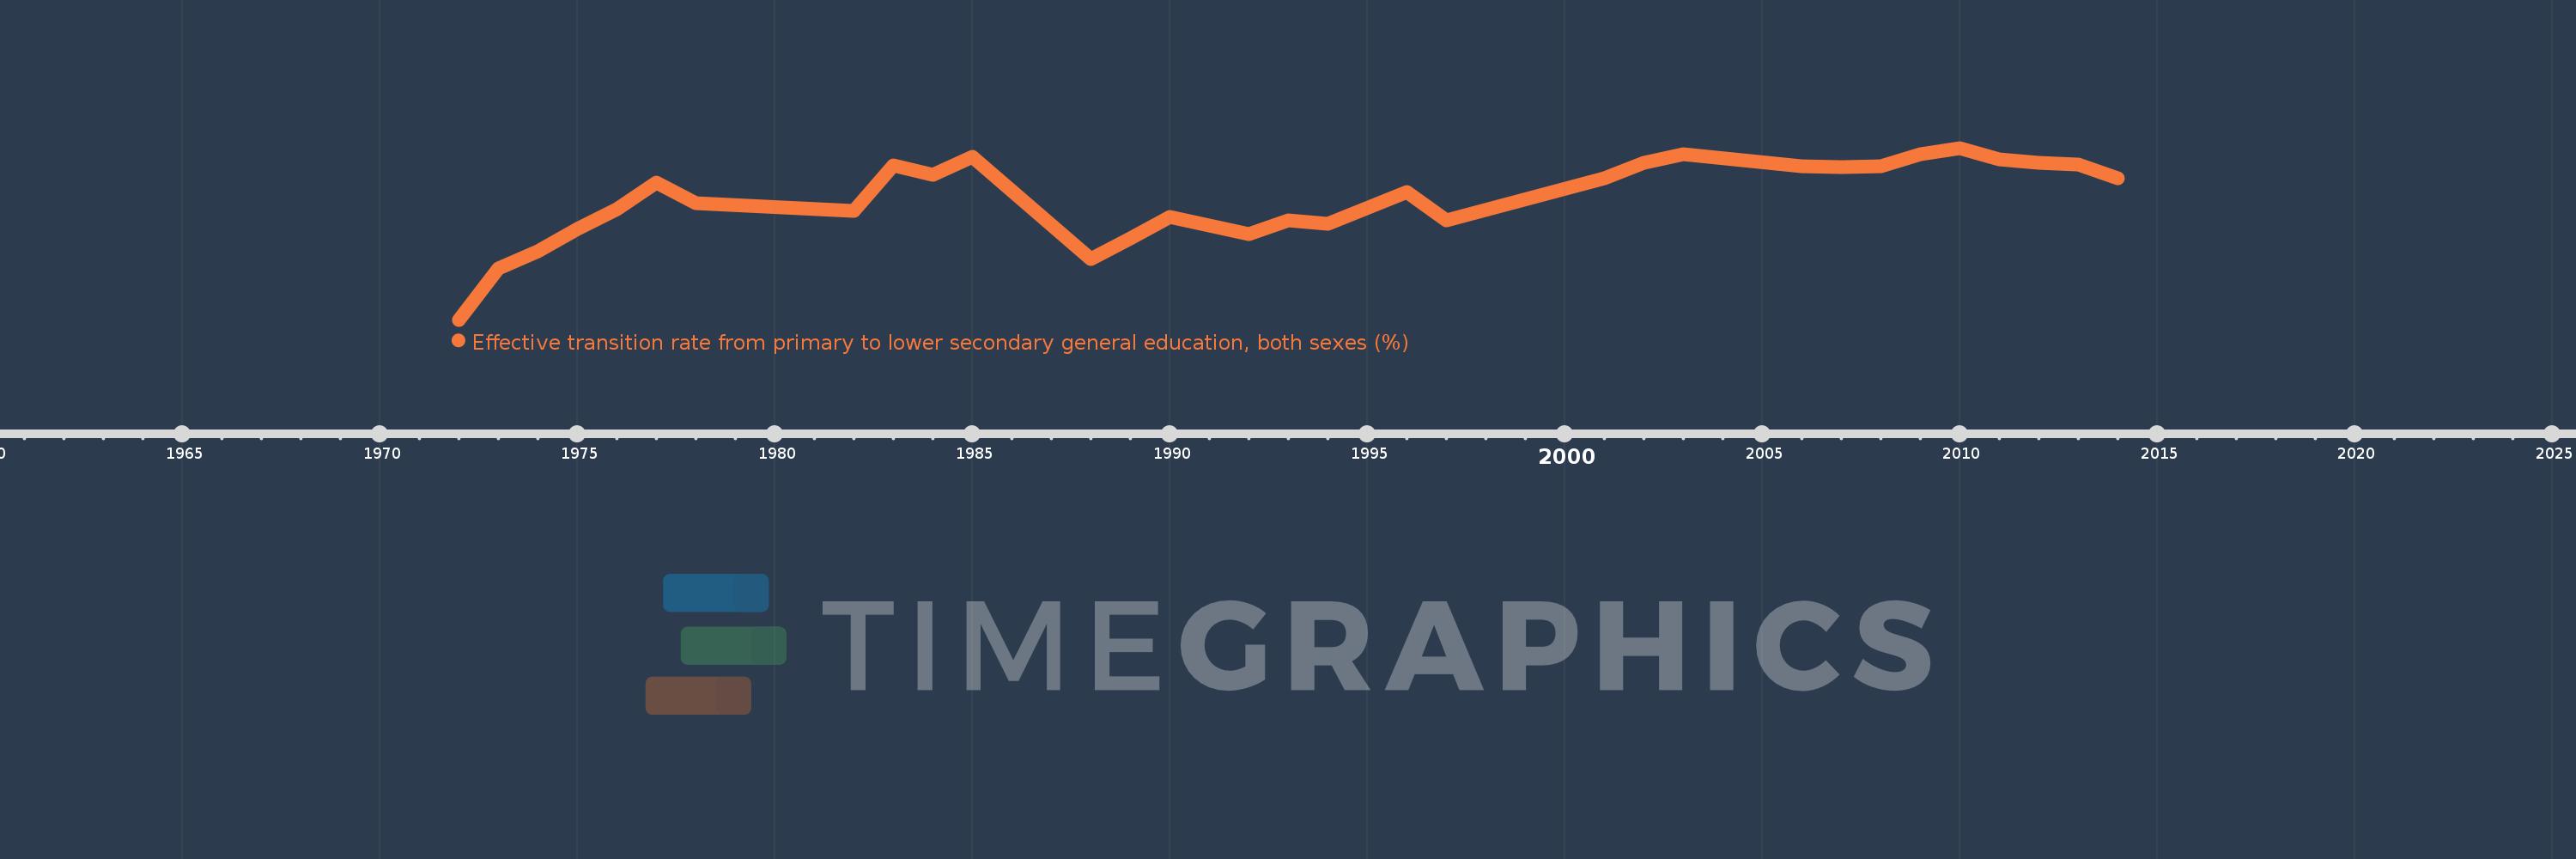
Effective transition rate from primary to lower secondary general education, both sexes (%)
2014,2013,2012,2011,2010,2009,2008,2007,2006,2003,2002,2001,1997,1996,1994,1993,1992,1990,1989,1988,1985,1984,1983,1982,1978,1977,1976,1975,1974,1973,1972
This statistics in other country:
AfghanistanAlbaniaAlgeriaAngolaAntigua and BarbudaArab WorldArgentinaArmeniaArubaAustriaAzerbaijanBahamas, TheBahrainBangladeshBarbadosBelarusBelgiumBelizeBeninBermudaBhutanBoliviaBosnia and HerzegovinaBotswanaBrazilBritish Virgin IslandsBrunei DarussalamBulgariaBurkina FasoBurundiCabo VerdeCambodiaCameroonCaribbean small statesCayman IslandsCentral African RepublicCentral Europe and the BalticsChadChileChinaColombiaComorosCongo, Dem. Rep.Congo, Rep.Costa RicaCote d'IvoireCroatiaCubaCyprusCzech RepublicDenmarkDjiboutiDominicaDominican RepublicEarly-demographic dividendEast Asia & PacificEast Asia & Pacific (excluding high income)East Asia & Pacific (IDA & IBRD countries)EcuadorEgypt, Arab Rep.El SalvadorEquatorial GuineaEritreaEstoniaEthiopiaEuro areaEurope & Central AsiaEurope & Central Asia (excluding high income)Europe & Central Asia (IDA & IBRD countries)European UnionFijiFinlandFragile and conflict affected situationsFranceGabonGambia, TheGeorgiaGermanyGhanaGreeceGrenadaGuatemalaGuineaGuinea-BissauGuyanaHaitiHeavily indebted poor countries (HIPC)High incomeHondurasHong Kong SAR, ChinaHungaryIBRD onlyIcelandIDA & IBRD totalIDA blendIDA onlyIDA totalIndiaIndonesiaIran, Islamic Rep.IraqIsraelItalyJamaicaJapanJordanKazakhstanKenyaKiribatiKorea, Rep.KuwaitKyrgyz RepublicLao PDRLate-demographic dividendLatin America & Caribbean Latin America & Caribbean (excluding high income)Latin America & the Caribbean (IDA & IBRD countries)LatviaLeast developed countries: UN classificationLebanonLesothoLiberiaLibyaLiechtensteinLithuaniaLow & middle incomeLow incomeLower middle incomeLuxembourgMacao SAR, ChinaMacedonia, FYRMadagascarMalawiMalaysiaMaldivesMaliMaltaMarshall IslandsMauritaniaMauritiusMexicoMiddle East & North AfricaMiddle East & North Africa (excluding high income)Middle East & North Africa (IDA & IBRD countries)Middle incomeMoldovaMonacoMongoliaMoroccoMozambiqueMyanmarNamibiaNepalNetherlandsNicaraguaNigerNorwayOECD membersOmanOther small statesPacific island small statesPakistanPalauPanamaParaguayPeruPhilippinesPolandPortugalPost-demographic dividendPre-demographic dividendQatarRomaniaRussian FederationRwandaSamoaSan MarinoSao Tome and PrincipeSaudi ArabiaSenegalSerbiaSeychellesSierra LeoneSingaporeSlovak RepublicSloveniaSmall statesSolomon IslandsSouth AfricaSouth AsiaSouth Asia (IDA & IBRD)SpainSri LankaSt. Kitts and NevisSt. LuciaSt. Vincent and the GrenadinesSub-Saharan Africa Sub-Saharan Africa (excluding high income)Sub-Saharan Africa (IDA & IBRD countries)SudanSurinameSwazilandSwedenSwitzerlandSyrian Arab RepublicTajikistanTanzaniaThailandTimor-LesteTogoTongaTrinidad and TobagoTunisiaTurkeyTurks and Caicos IslandsTuvaluUgandaUkraineUnited Arab EmiratesUpper middle incomeUruguayUzbekistanVanuatuVenezuela, RBVietnamWest Bank and GazaWorldYemen, Rep.ZambiaZimbabwe Timeline:
This timeline shows a graph from 1972 to 2014 of El Salvador. No data until 1971. Number of actual observations by date: 31.
Source name:
World Development Indicators
Source organization:
UNESCO Institute for Statistics
Categories, topics:
Education
Last updated:
apr 23, 2017
Indicators value changes by year
Minimum:
69.209
jan 1, 1972
Maximum:
98.311
jan 1, 2010
At the date of observation
Value
Absolute change
Change from previous value
jan 1, 1972
69.209
+69.209
0.0%
jan 1, 1973
77.872
+8.663
12.52%
jan 1, 1974
80.765
+2.893
3.71%
jan 1, 1975
84.661
+3.896
4.82%
jan 1, 1976
87.9
+3.239
3.83%
jan 1, 1977
92.492
+4.592
5.22%
jan 1, 1978
88.901
-3.591
-3.88%
jan 1, 1982
87.697
-1.204
-1.35%
jan 1, 1983
95.337
+7.64
8.71%
jan 1, 1984
93.809
-1.529
-1.6%
jan 1, 1985
96.849
+3.04
3.24%
jan 1, 1988
79.5
-17.348
-17.91%
jan 1, 1989
83.046
+3.546
4.46%
jan 1, 1990
86.668
+3.622
4.36%
jan 1, 1992
83.704
-2.964
-3.42%
jan 1, 1993
86.102
+2.398
2.87%
jan 1, 1994
85.408
-0.694
-0.81%
jan 1, 1996
90.879
+5.471
6.41%
jan 1, 1997
86.013
-4.866
-5.35%
jan 1, 2001
93.215
+7.201
8.37%
jan 1, 2002
95.827
+2.613
2.8%
jan 1, 2003
97.18
+1.353
1.41%
jan 1, 2006
95.235
-1.945
-2.0%
jan 1, 2007
95.01
-0.226
-0.24%
jan 1, 2008
95.183
+0.173
0.18%
jan 1, 2009
97.289
+2.106
2.21%
jan 1, 2010
98.311
+1.022
1.05%
jan 1, 2011
96.321
-1.99
-2.02%
jan 1, 2012
95.82
-0.501
-0.52%
jan 1, 2013
95.53
-0.291
-0.3%
jan 1, 2014
93.142
-2.387
-2.5%
Ranking of countries by current statistics by years


Comments: