29
/
en
AIzaSyAYiBZKx7MnpbEhh9jyipgxe19OcubqV5w
April 1, 2024
116779
Cyprus
CYP
true
2
1
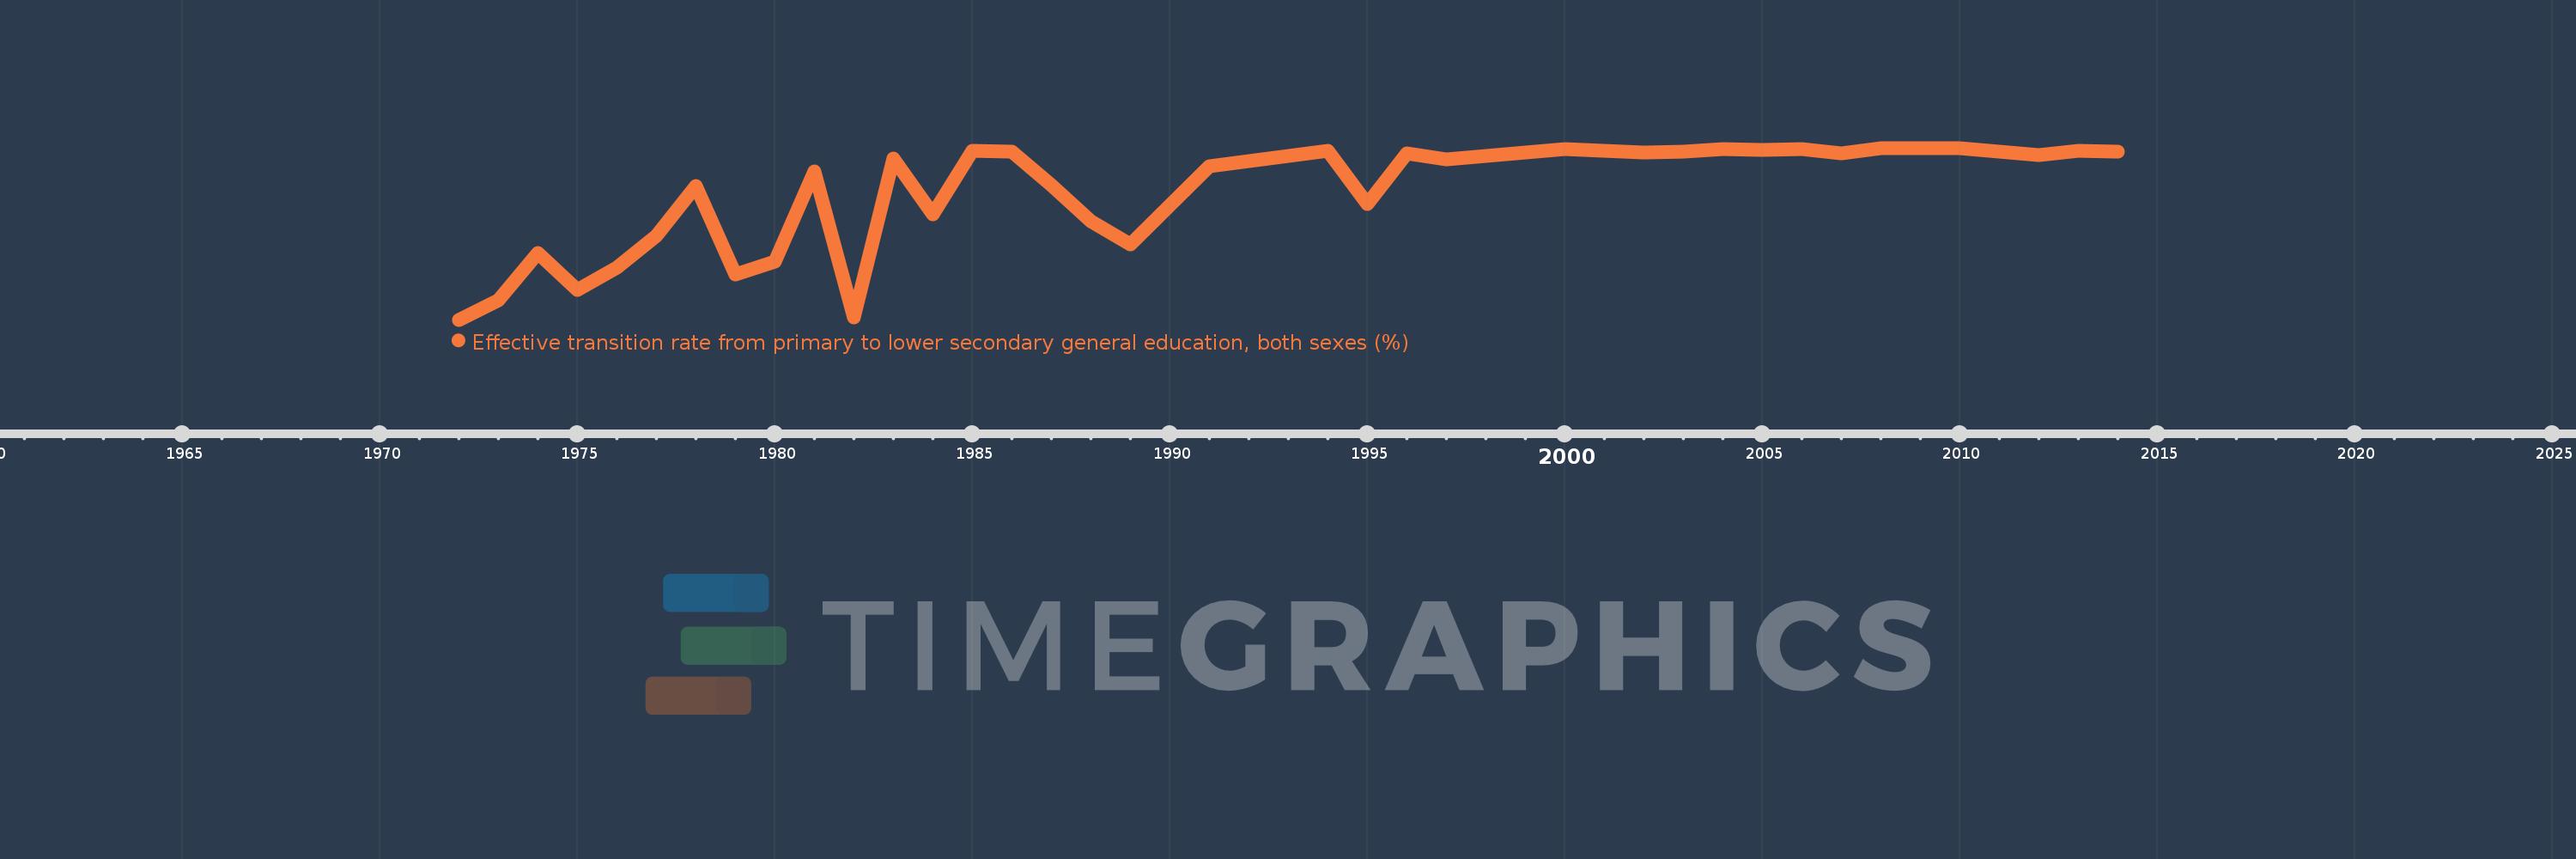
Effective transition rate from primary to lower secondary general education, both sexes (%)
2014,2013,2012,2011,2010,2009,2008,2007,2006,2005,2004,2003,2002,2001,2000,1998,1997,1996,1995,1994,1991,1989,1988,1987,1986,1985,1984,1983,1982,1981,1980,1979,1978,1977,1976,1975,1974,1973,1972
This statistics in other country:
AfghanistanAlbaniaAlgeriaAngolaAntigua and BarbudaArab WorldArgentinaArmeniaArubaAustriaAzerbaijanBahamas, TheBahrainBangladeshBarbadosBelarusBelgiumBelizeBeninBermudaBhutanBoliviaBosnia and HerzegovinaBotswanaBrazilBritish Virgin IslandsBrunei DarussalamBulgariaBurkina FasoBurundiCabo VerdeCambodiaCameroonCaribbean small statesCayman IslandsCentral African RepublicCentral Europe and the BalticsChadChileChinaColombiaComorosCongo, Dem. Rep.Congo, Rep.Costa RicaCote d'IvoireCroatiaCubaCyprusCzech RepublicDenmarkDjiboutiDominicaDominican RepublicEarly-demographic dividendEast Asia & PacificEast Asia & Pacific (excluding high income)East Asia & Pacific (IDA & IBRD countries)EcuadorEgypt, Arab Rep.El SalvadorEquatorial GuineaEritreaEstoniaEthiopiaEuro areaEurope & Central AsiaEurope & Central Asia (excluding high income)Europe & Central Asia (IDA & IBRD countries)European UnionFijiFinlandFragile and conflict affected situationsFranceGabonGambia, TheGeorgiaGermanyGhanaGreeceGrenadaGuatemalaGuineaGuinea-BissauGuyanaHaitiHeavily indebted poor countries (HIPC)High incomeHondurasHong Kong SAR, ChinaHungaryIBRD onlyIcelandIDA & IBRD totalIDA blendIDA onlyIDA totalIndiaIndonesiaIran, Islamic Rep.IraqIsraelItalyJamaicaJapanJordanKazakhstanKenyaKiribatiKorea, Rep.KuwaitKyrgyz RepublicLao PDRLate-demographic dividendLatin America & Caribbean Latin America & Caribbean (excluding high income)Latin America & the Caribbean (IDA & IBRD countries)LatviaLeast developed countries: UN classificationLebanonLesothoLiberiaLibyaLiechtensteinLithuaniaLow & middle incomeLow incomeLower middle incomeLuxembourgMacao SAR, ChinaMacedonia, FYRMadagascarMalawiMalaysiaMaldivesMaliMaltaMarshall IslandsMauritaniaMauritiusMexicoMiddle East & North AfricaMiddle East & North Africa (excluding high income)Middle East & North Africa (IDA & IBRD countries)Middle incomeMoldovaMonacoMongoliaMoroccoMozambiqueMyanmarNamibiaNepalNetherlandsNicaraguaNigerNorwayOECD membersOmanOther small statesPacific island small statesPakistanPalauPanamaParaguayPeruPhilippinesPolandPortugalPost-demographic dividendPre-demographic dividendQatarRomaniaRussian FederationRwandaSamoaSan MarinoSao Tome and PrincipeSaudi ArabiaSenegalSerbiaSeychellesSierra LeoneSingaporeSlovak RepublicSloveniaSmall statesSolomon IslandsSouth AfricaSouth AsiaSouth Asia (IDA & IBRD)SpainSri LankaSt. Kitts and NevisSt. LuciaSt. Vincent and the GrenadinesSub-Saharan Africa Sub-Saharan Africa (excluding high income)Sub-Saharan Africa (IDA & IBRD countries)SudanSurinameSwazilandSwedenSwitzerlandSyrian Arab RepublicTajikistanTanzaniaThailandTimor-LesteTogoTongaTrinidad and TobagoTunisiaTurkeyTurks and Caicos IslandsTuvaluUgandaUkraineUnited Arab EmiratesUpper middle incomeUruguayUzbekistanVanuatuVenezuela, RBVietnamWest Bank and GazaWorldYemen, Rep.ZambiaZimbabwe Timeline:
This timeline shows a graph from 1972 to 2014 of Cyprus. No data until 1971. Number of actual observations by date: 39.
Source name:
World Development Indicators
Source organization:
UNESCO Institute for Statistics
Categories, topics:
Education
Last updated:
apr 23, 2017
Indicators value changes by year
Minimum:
73.962
jan 1, 1972
Maximum:
99.994
jan 1, 2009
At the date of observation
Value
Absolute change
Change from previous value
jan 1, 1972
73.962
+73.962
0.0%
jan 1, 1973
76.92
+2.958
4.0%
jan 1, 1974
84.066
+7.147
9.29%
jan 1, 1975
78.435
-5.631
-6.7%
jan 1, 1976
81.821
+3.386
4.32%
jan 1, 1977
86.739
+4.918
6.01%
jan 1, 1978
94.22
+7.481
8.62%
jan 1, 1979
80.844
-13.376
-14.2%
jan 1, 1980
82.83
+1.986
2.46%
jan 1, 1981
96.495
+13.665
16.5%
jan 1, 1982
74.368
-22.128
-22.93%
jan 1, 1983
98.428
+24.061
32.35%
jan 1, 1984
89.959
-8.469
-8.6%
jan 1, 1985
99.575
+9.615
10.69%
jan 1, 1986
99.445
-0.129
-0.13%
jan 1, 1987
94.383
-5.063
-5.09%
jan 1, 1988
88.914
-5.469
-5.79%
jan 1, 1989
85.392
-3.522
-3.96%
jan 1, 1991
97.259
+11.866
13.9%
jan 1, 1994
99.524
+2.266
2.33%
jan 1, 1995
91.542
-7.982
-8.02%
jan 1, 1996
99.178
+7.636
8.34%
jan 1, 1997
98.24
-0.938
-0.95%
jan 1, 1998
98.815
+0.575
0.59%
jan 1, 2000
99.819
+1.003
1.02%
jan 1, 2001
99.527
-0.292
-0.29%
jan 1, 2002
99.276
-0.25
-0.25%
jan 1, 2003
99.442
+0.166
0.17%
jan 1, 2004
99.809
+0.367
0.37%
jan 1, 2005
99.682
-0.127
-0.13%
jan 1, 2006
99.786
+0.104
0.1%
jan 1, 2007
99.149
-0.637
-0.64%
jan 1, 2008
99.913
+0.764
0.77%
jan 1, 2009
99.994
+0.081
0.08%
jan 1, 2010
99.903
-0.091
-0.09%
jan 1, 2011
99.431
-0.472
-0.47%
jan 1, 2012
98.884
-0.548
-0.55%
jan 1, 2013
99.537
+0.653
0.66%
jan 1, 2014
99.383
-0.154
-0.15%
Ranking of countries by current statistics by years


Comments: