29
/
en
AIzaSyAYiBZKx7MnpbEhh9jyipgxe19OcubqV5w
April 1, 2024
34885
Heavily indebted poor countries (HIPC)
HPC
false
2
1
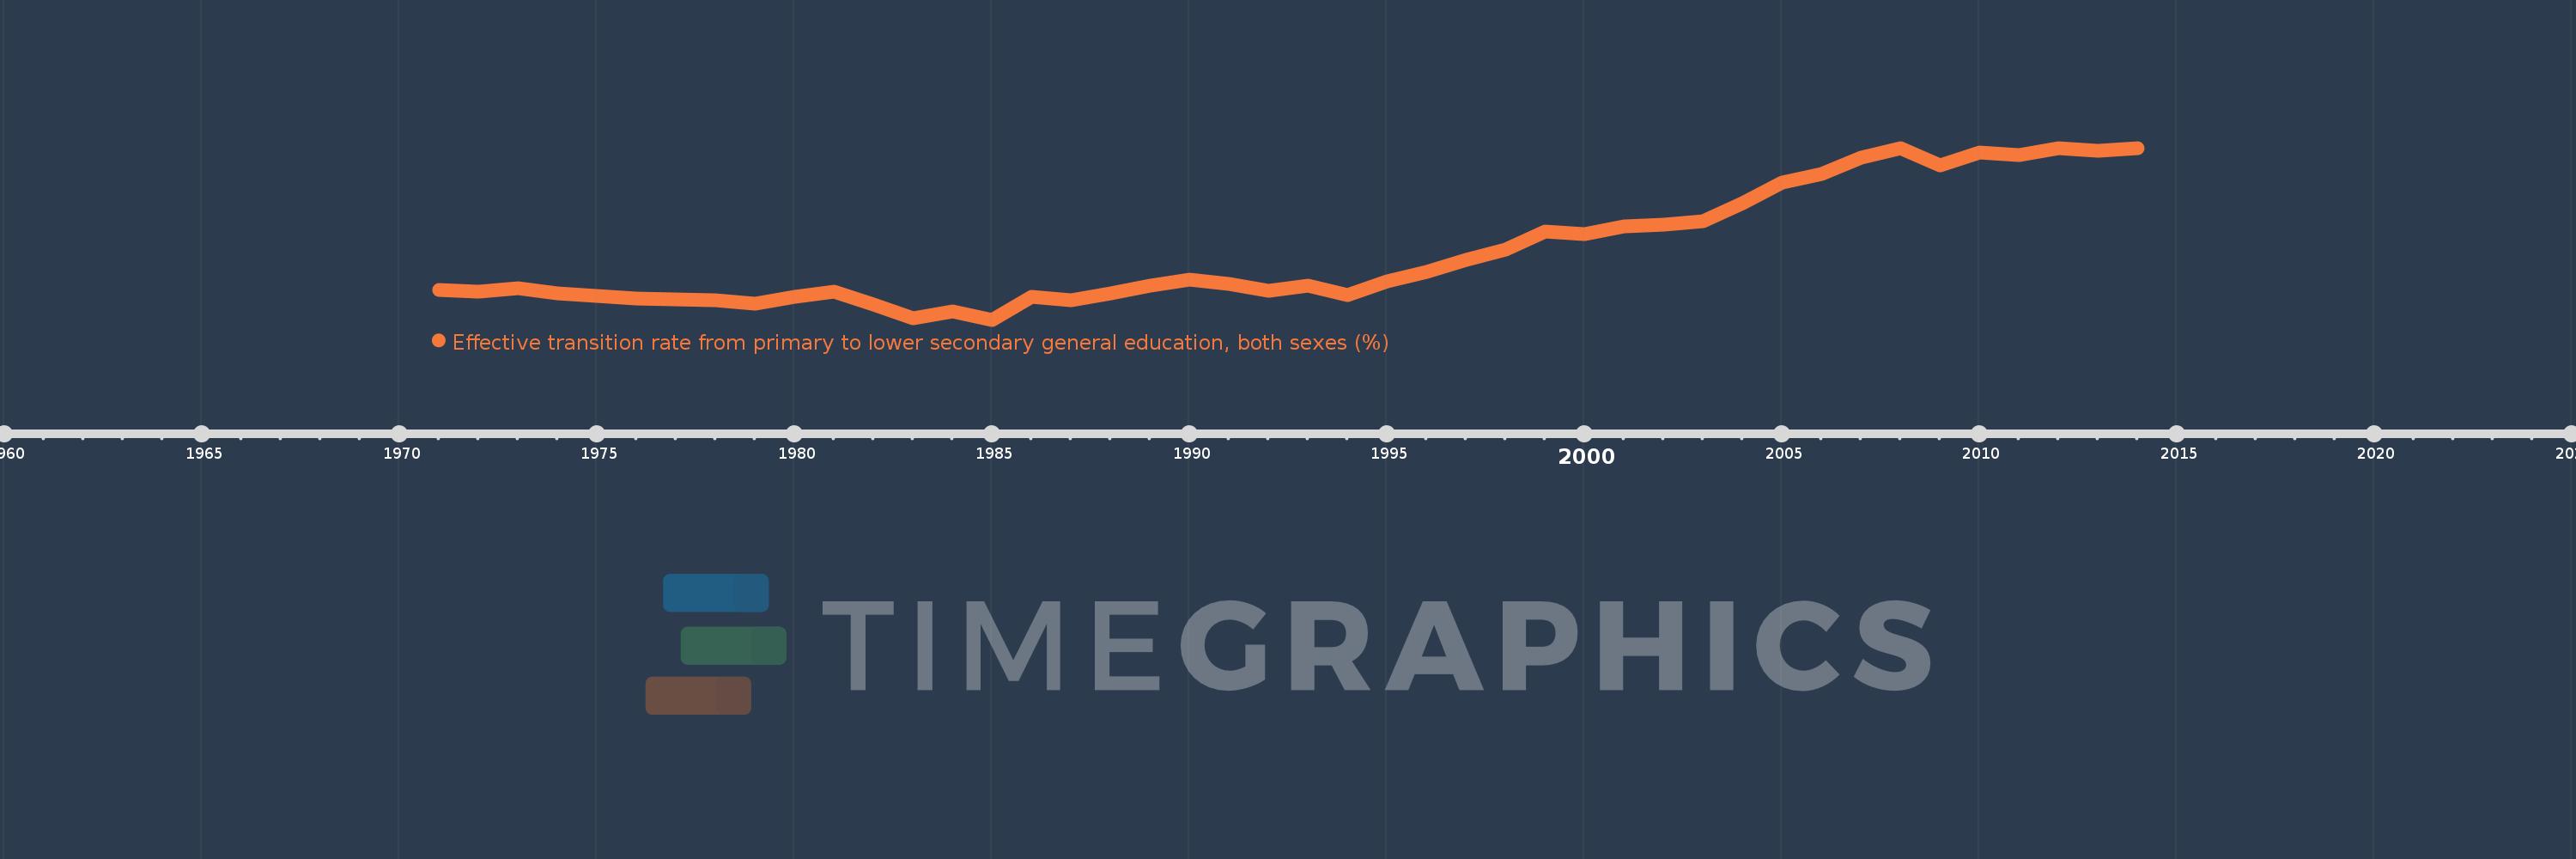
Effective transition rate from primary to lower secondary general education, both sexes (%)
2014,2013,2012,2011,2010,2009,2008,2007,2006,2005,2004,2003,2002,2001,2000,1999,1998,1997,1996,1995,1994,1993,1992,1991,1990,1989,1988,1987,1986,1985,1984,1983,1982,1981,1980,1979,1978,1977,1976,1975,1974,1973,1972,1971
This statistics in other country:
AfghanistanAlbaniaAlgeriaAngolaAntigua and BarbudaArab WorldArgentinaArmeniaArubaAustriaAzerbaijanBahamas, TheBahrainBangladeshBarbadosBelarusBelgiumBelizeBeninBermudaBhutanBoliviaBosnia and HerzegovinaBotswanaBrazilBritish Virgin IslandsBrunei DarussalamBulgariaBurkina FasoBurundiCabo VerdeCambodiaCameroonCaribbean small statesCayman IslandsCentral African RepublicCentral Europe and the BalticsChadChileChinaColombiaComorosCongo, Dem. Rep.Congo, Rep.Costa RicaCote d'IvoireCroatiaCubaCyprusCzech RepublicDenmarkDjiboutiDominicaDominican RepublicEarly-demographic dividendEast Asia & PacificEast Asia & Pacific (excluding high income)East Asia & Pacific (IDA & IBRD countries)EcuadorEgypt, Arab Rep.El SalvadorEquatorial GuineaEritreaEstoniaEthiopiaEuro areaEurope & Central AsiaEurope & Central Asia (excluding high income)Europe & Central Asia (IDA & IBRD countries)European UnionFijiFinlandFragile and conflict affected situationsFranceGabonGambia, TheGeorgiaGermanyGhanaGreeceGrenadaGuatemalaGuineaGuinea-BissauGuyanaHaitiHeavily indebted poor countries (HIPC)High incomeHondurasHong Kong SAR, ChinaHungaryIBRD onlyIcelandIDA & IBRD totalIDA blendIDA onlyIDA totalIndiaIndonesiaIran, Islamic Rep.IraqIsraelItalyJamaicaJapanJordanKazakhstanKenyaKiribatiKorea, Rep.KuwaitKyrgyz RepublicLao PDRLate-demographic dividendLatin America & Caribbean Latin America & Caribbean (excluding high income)Latin America & the Caribbean (IDA & IBRD countries)LatviaLeast developed countries: UN classificationLebanonLesothoLiberiaLibyaLiechtensteinLithuaniaLow & middle incomeLow incomeLower middle incomeLuxembourgMacao SAR, ChinaMacedonia, FYRMadagascarMalawiMalaysiaMaldivesMaliMaltaMarshall IslandsMauritaniaMauritiusMexicoMiddle East & North AfricaMiddle East & North Africa (excluding high income)Middle East & North Africa (IDA & IBRD countries)Middle incomeMoldovaMonacoMongoliaMoroccoMozambiqueMyanmarNamibiaNepalNetherlandsNicaraguaNigerNorwayOECD membersOmanOther small statesPacific island small statesPakistanPalauPanamaParaguayPeruPhilippinesPolandPortugalPost-demographic dividendPre-demographic dividendQatarRomaniaRussian FederationRwandaSamoaSan MarinoSao Tome and PrincipeSaudi ArabiaSenegalSerbiaSeychellesSierra LeoneSingaporeSlovak RepublicSloveniaSmall statesSolomon IslandsSouth AfricaSouth AsiaSouth Asia (IDA & IBRD)SpainSri LankaSt. Kitts and NevisSt. LuciaSt. Vincent and the GrenadinesSub-Saharan Africa Sub-Saharan Africa (excluding high income)Sub-Saharan Africa (IDA & IBRD countries)SudanSurinameSwazilandSwedenSwitzerlandSyrian Arab RepublicTajikistanTanzaniaThailandTimor-LesteTogoTongaTrinidad and TobagoTunisiaTurkeyTurks and Caicos IslandsTuvaluUgandaUkraineUnited Arab EmiratesUpper middle incomeUruguayUzbekistanVanuatuVenezuela, RBVietnamWest Bank and GazaWorldYemen, Rep.ZambiaZimbabwe Timeline:
This timeline shows a graph from 1971 to 2014 of Heavily indebted poor countries (HIPC). No data until 1970. Number of actual observations by date: 44.
Source name:
World Development Indicators
Source organization:
UNESCO Institute for Statistics
Categories, topics:
Education
Last updated:
apr 23, 2017
Indicators value changes by year
Minimum:
51.792
jan 1, 1985
Maximum:
76.558
jan 1, 2014
At the date of observation
Value
Absolute change
Change from previous value
jan 1, 1971
56.05
+56.05
0.0%
jan 1, 1972
55.792
-0.258
-0.46%
jan 1, 1973
56.343
+0.55
0.99%
jan 1, 1974
55.627
-0.715
-1.27%
jan 1, 1975
55.17
-0.458
-0.82%
jan 1, 1976
54.889
-0.281
-0.51%
jan 1, 1977
54.733
-0.156
-0.28%
jan 1, 1978
54.615
-0.118
-0.22%
jan 1, 1979
54.14
-0.476
-0.87%
jan 1, 1980
55.13
+0.991
1.83%
jan 1, 1981
55.861
+0.731
1.33%
jan 1, 1982
54.013
-1.847
-3.31%
jan 1, 1983
51.983
-2.03
-3.76%
jan 1, 1984
52.932
+0.948
1.82%
jan 1, 1985
51.792
-1.14
-2.15%
jan 1, 1986
55.147
+3.355
6.48%
jan 1, 1987
54.607
-0.54
-0.98%
jan 1, 1988
55.553
+0.946
1.73%
jan 1, 1989
56.73
+1.178
2.12%
jan 1, 1990
57.534
+0.804
1.42%
jan 1, 1991
56.955
-0.579
-1.01%
jan 1, 1992
55.927
-1.028
-1.81%
jan 1, 1993
56.732
+0.805
1.44%
jan 1, 1994
55.311
-1.421
-2.5%
jan 1, 1995
57.316
+2.006
3.63%
jan 1, 1996
58.637
+1.321
2.3%
jan 1, 1997
60.478
+1.841
3.14%
jan 1, 1998
61.936
+1.458
2.41%
jan 1, 1999
64.487
+2.55
4.12%
jan 1, 2000
64.118
-0.368
-0.57%
jan 1, 2001
65.275
+1.157
1.8%
jan 1, 2002
65.547
+0.272
0.42%
jan 1, 2003
65.944
+0.397
0.61%
jan 1, 2004
68.637
+2.693
4.08%
jan 1, 2005
71.6
+2.963
4.32%
jan 1, 2006
72.774
+1.174
1.64%
jan 1, 2007
75.105
+2.331
3.2%
jan 1, 2008
76.492
+1.387
1.85%
jan 1, 2009
74.003
-2.489
-3.25%
jan 1, 2010
75.919
+1.916
2.59%
jan 1, 2011
75.545
-0.374
-0.49%
jan 1, 2012
76.493
+0.948
1.26%
jan 1, 2013
76.167
-0.327
-0.43%
jan 1, 2014
76.558
+0.391
0.51%
Ranking of countries by current statistics by years


Comments: