29
/
en
AIzaSyAYiBZKx7MnpbEhh9jyipgxe19OcubqV5w
April 1, 2024
43329
Latin America & the Caribbean (IDA & IBRD countries)
TLA
false
2
1
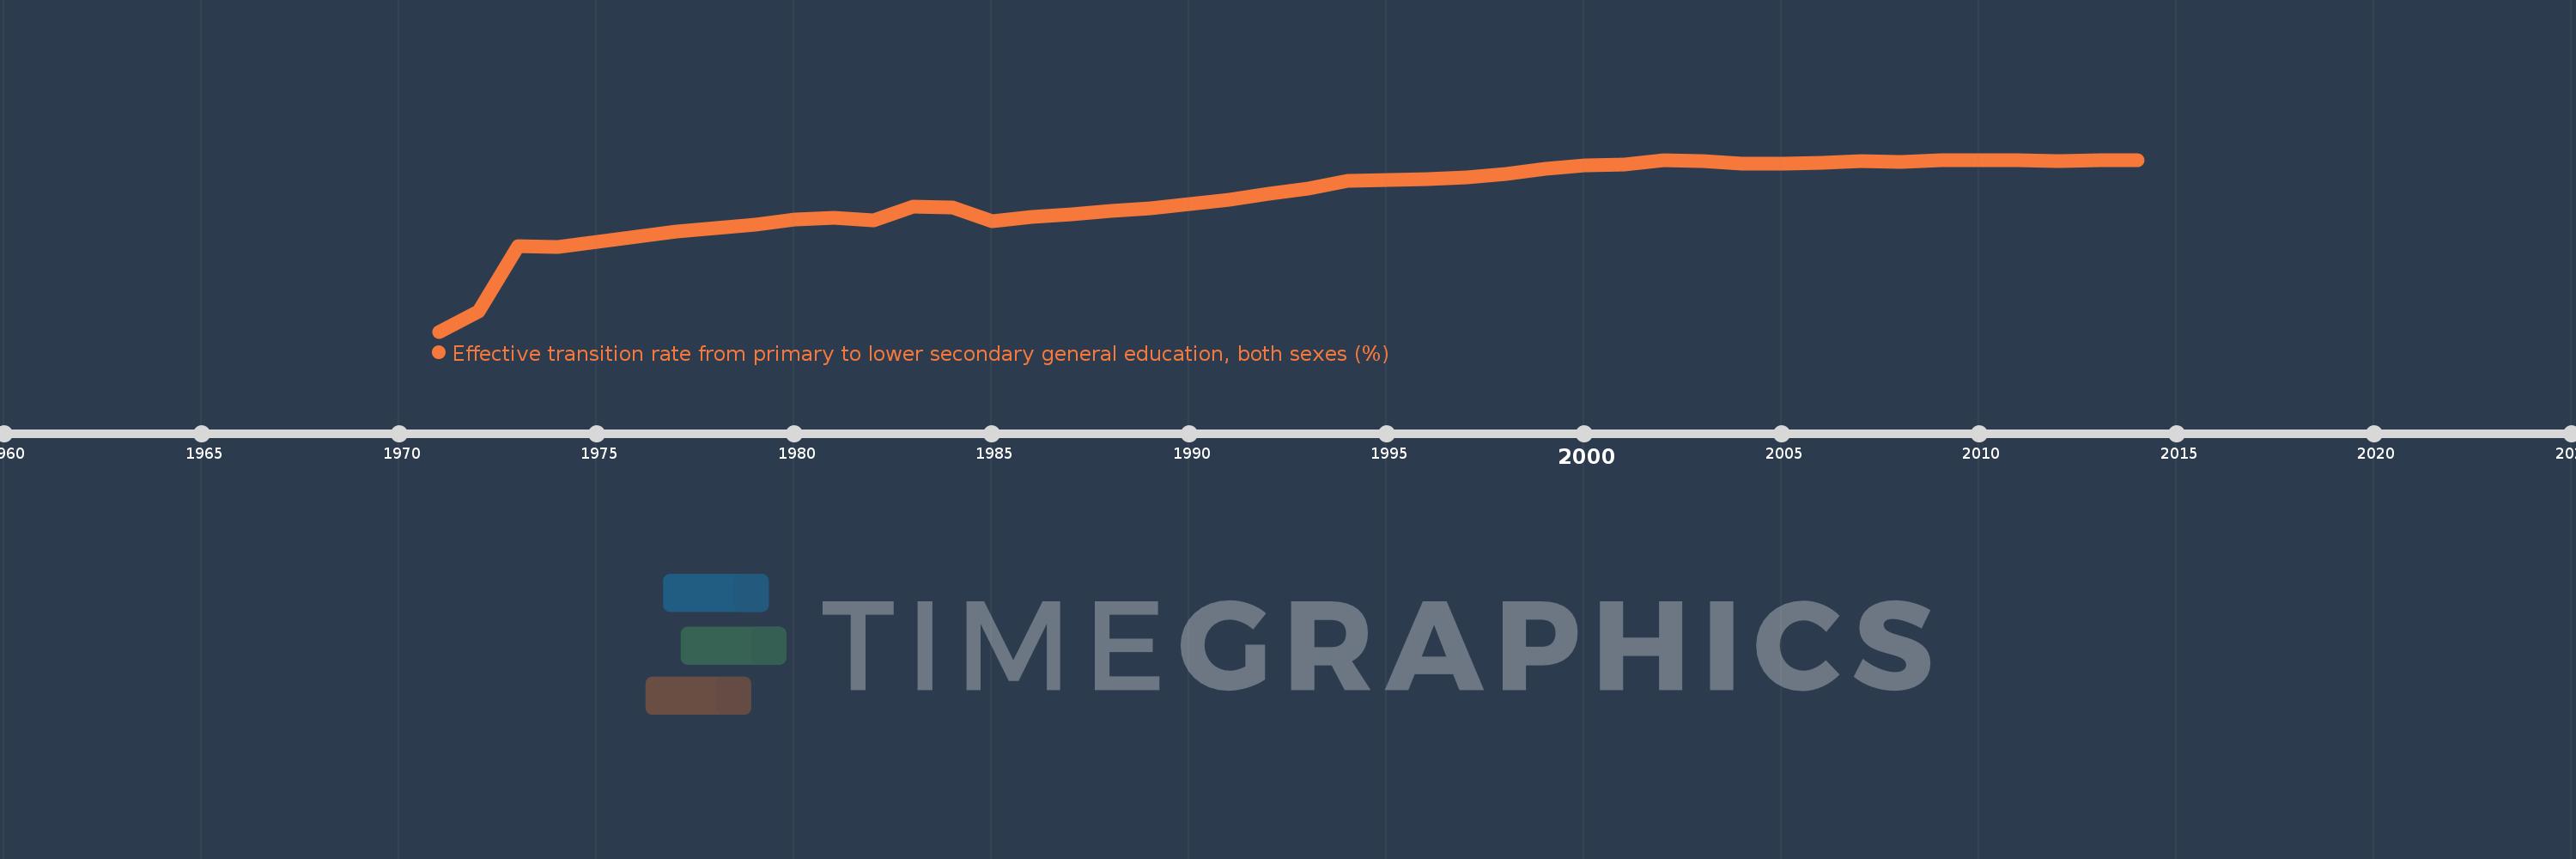
Effective transition rate from primary to lower secondary general education, both sexes (%)
2014,2013,2012,2011,2010,2009,2008,2007,2006,2005,2004,2003,2002,2001,2000,1999,1998,1997,1996,1995,1994,1993,1992,1991,1990,1989,1988,1987,1986,1985,1984,1983,1982,1981,1980,1979,1978,1977,1976,1975,1974,1973,1972,1971
This statistics in other country:
AfghanistanAlbaniaAlgeriaAngolaAntigua and BarbudaArab WorldArgentinaArmeniaArubaAustriaAzerbaijanBahamas, TheBahrainBangladeshBarbadosBelarusBelgiumBelizeBeninBermudaBhutanBoliviaBosnia and HerzegovinaBotswanaBrazilBritish Virgin IslandsBrunei DarussalamBulgariaBurkina FasoBurundiCabo VerdeCambodiaCameroonCaribbean small statesCayman IslandsCentral African RepublicCentral Europe and the BalticsChadChileChinaColombiaComorosCongo, Dem. Rep.Congo, Rep.Costa RicaCote d'IvoireCroatiaCubaCyprusCzech RepublicDenmarkDjiboutiDominicaDominican RepublicEarly-demographic dividendEast Asia & PacificEast Asia & Pacific (excluding high income)East Asia & Pacific (IDA & IBRD countries)EcuadorEgypt, Arab Rep.El SalvadorEquatorial GuineaEritreaEstoniaEthiopiaEuro areaEurope & Central AsiaEurope & Central Asia (excluding high income)Europe & Central Asia (IDA & IBRD countries)European UnionFijiFinlandFragile and conflict affected situationsFranceGabonGambia, TheGeorgiaGermanyGhanaGreeceGrenadaGuatemalaGuineaGuinea-BissauGuyanaHaitiHeavily indebted poor countries (HIPC)High incomeHondurasHong Kong SAR, ChinaHungaryIBRD onlyIcelandIDA & IBRD totalIDA blendIDA onlyIDA totalIndiaIndonesiaIran, Islamic Rep.IraqIsraelItalyJamaicaJapanJordanKazakhstanKenyaKiribatiKorea, Rep.KuwaitKyrgyz RepublicLao PDRLate-demographic dividendLatin America & Caribbean Latin America & Caribbean (excluding high income)Latin America & the Caribbean (IDA & IBRD countries)LatviaLeast developed countries: UN classificationLebanonLesothoLiberiaLibyaLiechtensteinLithuaniaLow & middle incomeLow incomeLower middle incomeLuxembourgMacao SAR, ChinaMacedonia, FYRMadagascarMalawiMalaysiaMaldivesMaliMaltaMarshall IslandsMauritaniaMauritiusMexicoMiddle East & North AfricaMiddle East & North Africa (excluding high income)Middle East & North Africa (IDA & IBRD countries)Middle incomeMoldovaMonacoMongoliaMoroccoMozambiqueMyanmarNamibiaNepalNetherlandsNicaraguaNigerNorwayOECD membersOmanOther small statesPacific island small statesPakistanPalauPanamaParaguayPeruPhilippinesPolandPortugalPost-demographic dividendPre-demographic dividendQatarRomaniaRussian FederationRwandaSamoaSan MarinoSao Tome and PrincipeSaudi ArabiaSenegalSerbiaSeychellesSierra LeoneSingaporeSlovak RepublicSloveniaSmall statesSolomon IslandsSouth AfricaSouth AsiaSouth Asia (IDA & IBRD)SpainSri LankaSt. Kitts and NevisSt. LuciaSt. Vincent and the GrenadinesSub-Saharan Africa Sub-Saharan Africa (excluding high income)Sub-Saharan Africa (IDA & IBRD countries)SudanSurinameSwazilandSwedenSwitzerlandSyrian Arab RepublicTajikistanTanzaniaThailandTimor-LesteTogoTongaTrinidad and TobagoTunisiaTurkeyTurks and Caicos IslandsTuvaluUgandaUkraineUnited Arab EmiratesUpper middle incomeUruguayUzbekistanVanuatuVenezuela, RBVietnamWest Bank and GazaWorldYemen, Rep.ZambiaZimbabwe Timeline:
This timeline shows a graph from 1971 to 2014 of Latin America & the Caribbean (IDA & IBRD countries). No data until 1970. Number of actual observations by date: 44.
Source name:
World Development Indicators
Source organization:
UNESCO Institute for Statistics
Categories, topics:
Education
Last updated:
apr 23, 2017
Indicators value changes by year
Minimum:
54.765
jan 1, 1971
Maximum:
95.054
jan 1, 2014
At the date of observation
Value
Absolute change
Change from previous value
jan 1, 1971
54.765
+54.765
0.0%
jan 1, 1972
59.514
+4.749
8.67%
jan 1, 1973
74.848
+15.334
25.77%
jan 1, 1974
74.519
-0.33
-0.44%
jan 1, 1975
75.742
+1.224
1.64%
jan 1, 1976
77.025
+1.282
1.69%
jan 1, 1977
78.325
+1.301
1.69%
jan 1, 1978
79.089
+0.763
0.97%
jan 1, 1979
79.889
+0.8
1.01%
jan 1, 1980
80.953
+1.065
1.33%
jan 1, 1981
81.557
+0.604
0.75%
jan 1, 1982
80.934
-0.623
-0.76%
jan 1, 1983
84.134
+3.199
3.95%
jan 1, 1984
83.789
-0.344
-0.41%
jan 1, 1985
80.629
-3.16
-3.77%
jan 1, 1986
81.577
+0.948
1.18%
jan 1, 1987
82.32
+0.743
0.91%
jan 1, 1988
83.143
+0.824
1.0%
jan 1, 1989
83.585
+0.442
0.53%
jan 1, 1990
84.739
+1.154
1.38%
jan 1, 1991
85.777
+1.038
1.22%
jan 1, 1992
87.041
+1.264
1.47%
jan 1, 1993
88.209
+1.168
1.34%
jan 1, 1994
90.083
+1.874
2.12%
jan 1, 1995
90.22
+0.137
0.15%
jan 1, 1996
90.611
+0.391
0.43%
jan 1, 1997
90.991
+0.38
0.42%
jan 1, 1998
91.675
+0.684
0.75%
jan 1, 1999
93.018
+1.343
1.47%
jan 1, 2000
93.82
+0.802
0.86%
jan 1, 2001
93.94
+0.12
0.13%
jan 1, 2002
95.043
+1.103
1.17%
jan 1, 2003
94.682
-0.362
-0.38%
jan 1, 2004
94.171
-0.511
-0.54%
jan 1, 2005
94.228
+0.058
0.06%
jan 1, 2006
94.405
+0.176
0.19%
jan 1, 2007
94.741
+0.336
0.36%
jan 1, 2008
94.548
-0.192
-0.2%
jan 1, 2009
95.014
+0.466
0.49%
jan 1, 2010
94.93
-0.085
-0.09%
jan 1, 2011
94.934
+0.004
0.0%
jan 1, 2012
94.682
-0.252
-0.27%
jan 1, 2013
94.989
+0.308
0.32%
jan 1, 2014
95.054
+0.065
0.07%
Ranking of countries by current statistics by years


Comments: