29
/
en
AIzaSyAYiBZKx7MnpbEhh9jyipgxe19OcubqV5w
April 1, 2024
48898
Middle East & North Africa (excluding high income)
MNA
false
2
1
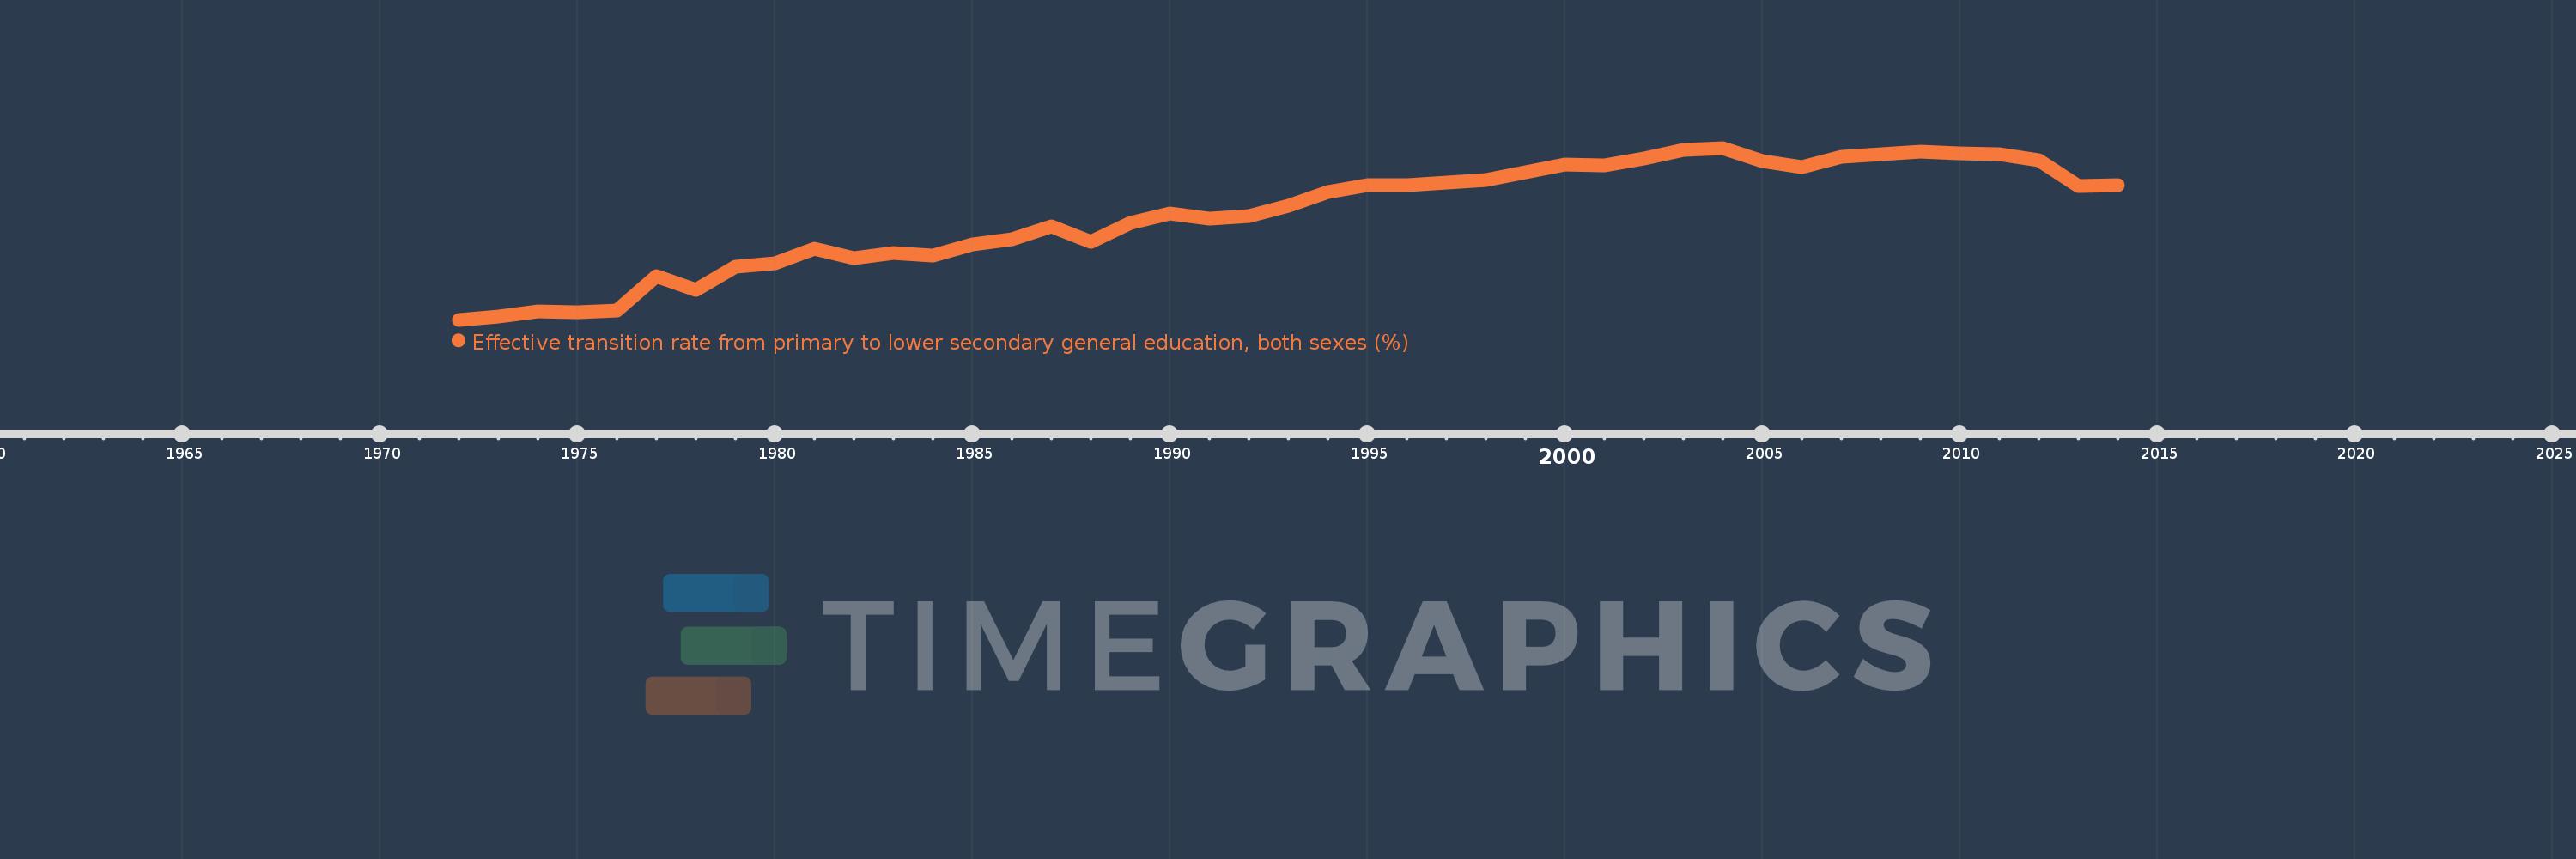
Effective transition rate from primary to lower secondary general education, both sexes (%)
2014,2013,2012,2011,2010,2009,2008,2007,2006,2005,2004,2003,2002,2001,2000,1999,1998,1997,1996,1995,1994,1993,1992,1991,1990,1989,1988,1987,1986,1985,1984,1983,1982,1981,1980,1979,1978,1977,1976,1975,1974,1973,1972
This statistics in other country:
AfghanistanAlbaniaAlgeriaAngolaAntigua and BarbudaArab WorldArgentinaArmeniaArubaAustriaAzerbaijanBahamas, TheBahrainBangladeshBarbadosBelarusBelgiumBelizeBeninBermudaBhutanBoliviaBosnia and HerzegovinaBotswanaBrazilBritish Virgin IslandsBrunei DarussalamBulgariaBurkina FasoBurundiCabo VerdeCambodiaCameroonCaribbean small statesCayman IslandsCentral African RepublicCentral Europe and the BalticsChadChileChinaColombiaComorosCongo, Dem. Rep.Congo, Rep.Costa RicaCote d'IvoireCroatiaCubaCyprusCzech RepublicDenmarkDjiboutiDominicaDominican RepublicEarly-demographic dividendEast Asia & PacificEast Asia & Pacific (excluding high income)East Asia & Pacific (IDA & IBRD countries)EcuadorEgypt, Arab Rep.El SalvadorEquatorial GuineaEritreaEstoniaEthiopiaEuro areaEurope & Central AsiaEurope & Central Asia (excluding high income)Europe & Central Asia (IDA & IBRD countries)European UnionFijiFinlandFragile and conflict affected situationsFranceGabonGambia, TheGeorgiaGermanyGhanaGreeceGrenadaGuatemalaGuineaGuinea-BissauGuyanaHaitiHeavily indebted poor countries (HIPC)High incomeHondurasHong Kong SAR, ChinaHungaryIBRD onlyIcelandIDA & IBRD totalIDA blendIDA onlyIDA totalIndiaIndonesiaIran, Islamic Rep.IraqIsraelItalyJamaicaJapanJordanKazakhstanKenyaKiribatiKorea, Rep.KuwaitKyrgyz RepublicLao PDRLate-demographic dividendLatin America & Caribbean Latin America & Caribbean (excluding high income)Latin America & the Caribbean (IDA & IBRD countries)LatviaLeast developed countries: UN classificationLebanonLesothoLiberiaLibyaLiechtensteinLithuaniaLow & middle incomeLow incomeLower middle incomeLuxembourgMacao SAR, ChinaMacedonia, FYRMadagascarMalawiMalaysiaMaldivesMaliMaltaMarshall IslandsMauritaniaMauritiusMexicoMiddle East & North AfricaMiddle East & North Africa (excluding high income)Middle East & North Africa (IDA & IBRD countries)Middle incomeMoldovaMonacoMongoliaMoroccoMozambiqueMyanmarNamibiaNepalNetherlandsNicaraguaNigerNorwayOECD membersOmanOther small statesPacific island small statesPakistanPalauPanamaParaguayPeruPhilippinesPolandPortugalPost-demographic dividendPre-demographic dividendQatarRomaniaRussian FederationRwandaSamoaSan MarinoSao Tome and PrincipeSaudi ArabiaSenegalSerbiaSeychellesSierra LeoneSingaporeSlovak RepublicSloveniaSmall statesSolomon IslandsSouth AfricaSouth AsiaSouth Asia (IDA & IBRD)SpainSri LankaSt. Kitts and NevisSt. LuciaSt. Vincent and the GrenadinesSub-Saharan Africa Sub-Saharan Africa (excluding high income)Sub-Saharan Africa (IDA & IBRD countries)SudanSurinameSwazilandSwedenSwitzerlandSyrian Arab RepublicTajikistanTanzaniaThailandTimor-LesteTogoTongaTrinidad and TobagoTunisiaTurkeyTurks and Caicos IslandsTuvaluUgandaUkraineUnited Arab EmiratesUpper middle incomeUruguayUzbekistanVanuatuVenezuela, RBVietnamWest Bank and GazaWorldYemen, Rep.ZambiaZimbabwe Timeline:
This timeline shows a graph from 1972 to 2014 of Middle East & North Africa (excluding high income). No data until 1971. Number of actual observations by date: 43.
Source name:
World Development Indicators
Source organization:
UNESCO Institute for Statistics
Categories, topics:
Education
Last updated:
apr 23, 2017
Indicators value changes by year
Minimum:
64.212
jan 1, 1972
Maximum:
93.138
jan 1, 2004
At the date of observation
Value
Absolute change
Change from previous value
jan 1, 1972
64.212
+64.212
0.0%
jan 1, 1973
64.725
+0.513
0.8%
jan 1, 1974
65.673
+0.948
1.46%
jan 1, 1975
65.434
-0.239
-0.36%
jan 1, 1976
65.745
+0.311
0.48%
jan 1, 1977
71.503
+5.759
8.76%
jan 1, 1978
69.282
-2.222
-3.11%
jan 1, 1979
73.189
+3.907
5.64%
jan 1, 1980
73.683
+0.494
0.68%
jan 1, 1981
76.242
+2.559
3.47%
jan 1, 1982
74.586
-1.656
-2.17%
jan 1, 1983
75.442
+0.856
1.15%
jan 1, 1984
75.047
-0.395
-0.52%
jan 1, 1985
76.93
+1.884
2.51%
jan 1, 1986
77.723
+0.792
1.03%
jan 1, 1987
79.977
+2.254
2.9%
jan 1, 1988
77.379
-2.598
-3.25%
jan 1, 1989
80.453
+3.074
3.97%
jan 1, 1990
82.146
+1.693
2.1%
jan 1, 1991
81.186
-0.96
-1.17%
jan 1, 1992
81.634
+0.447
0.55%
jan 1, 1993
83.475
+1.842
2.26%
jan 1, 1994
85.751
+2.276
2.73%
jan 1, 1995
86.865
+1.114
1.3%
jan 1, 1996
86.888
+0.023
0.03%
jan 1, 1997
87.252
+0.364
0.42%
jan 1, 1998
87.789
+0.537
0.62%
jan 1, 1999
89.06
+1.271
1.45%
jan 1, 2000
90.286
+1.226
1.38%
jan 1, 2001
90.175
-0.112
-0.12%
jan 1, 2002
91.33
+1.155
1.28%
jan 1, 2003
92.828
+1.499
1.64%
jan 1, 2004
93.138
+0.31
0.33%
jan 1, 2005
90.989
-2.149
-2.31%
jan 1, 2006
89.907
-1.082
-1.19%
jan 1, 2007
91.621
+1.715
1.91%
jan 1, 2008
92.149
+0.528
0.58%
jan 1, 2009
92.51
+0.361
0.39%
jan 1, 2010
92.168
-0.343
-0.37%
jan 1, 2011
92.11
-0.058
-0.06%
jan 1, 2012
91.007
-1.103
-1.2%
jan 1, 2013
86.74
-4.267
-4.69%
jan 1, 2014
86.828
+0.088
0.1%
Ranking of countries by current statistics by years


Comments: