29
/
en
AIzaSyAYiBZKx7MnpbEhh9jyipgxe19OcubqV5w
April 1, 2024
32515
Europe & Central Asia (IDA & IBRD countries)
TEC
false
2
1
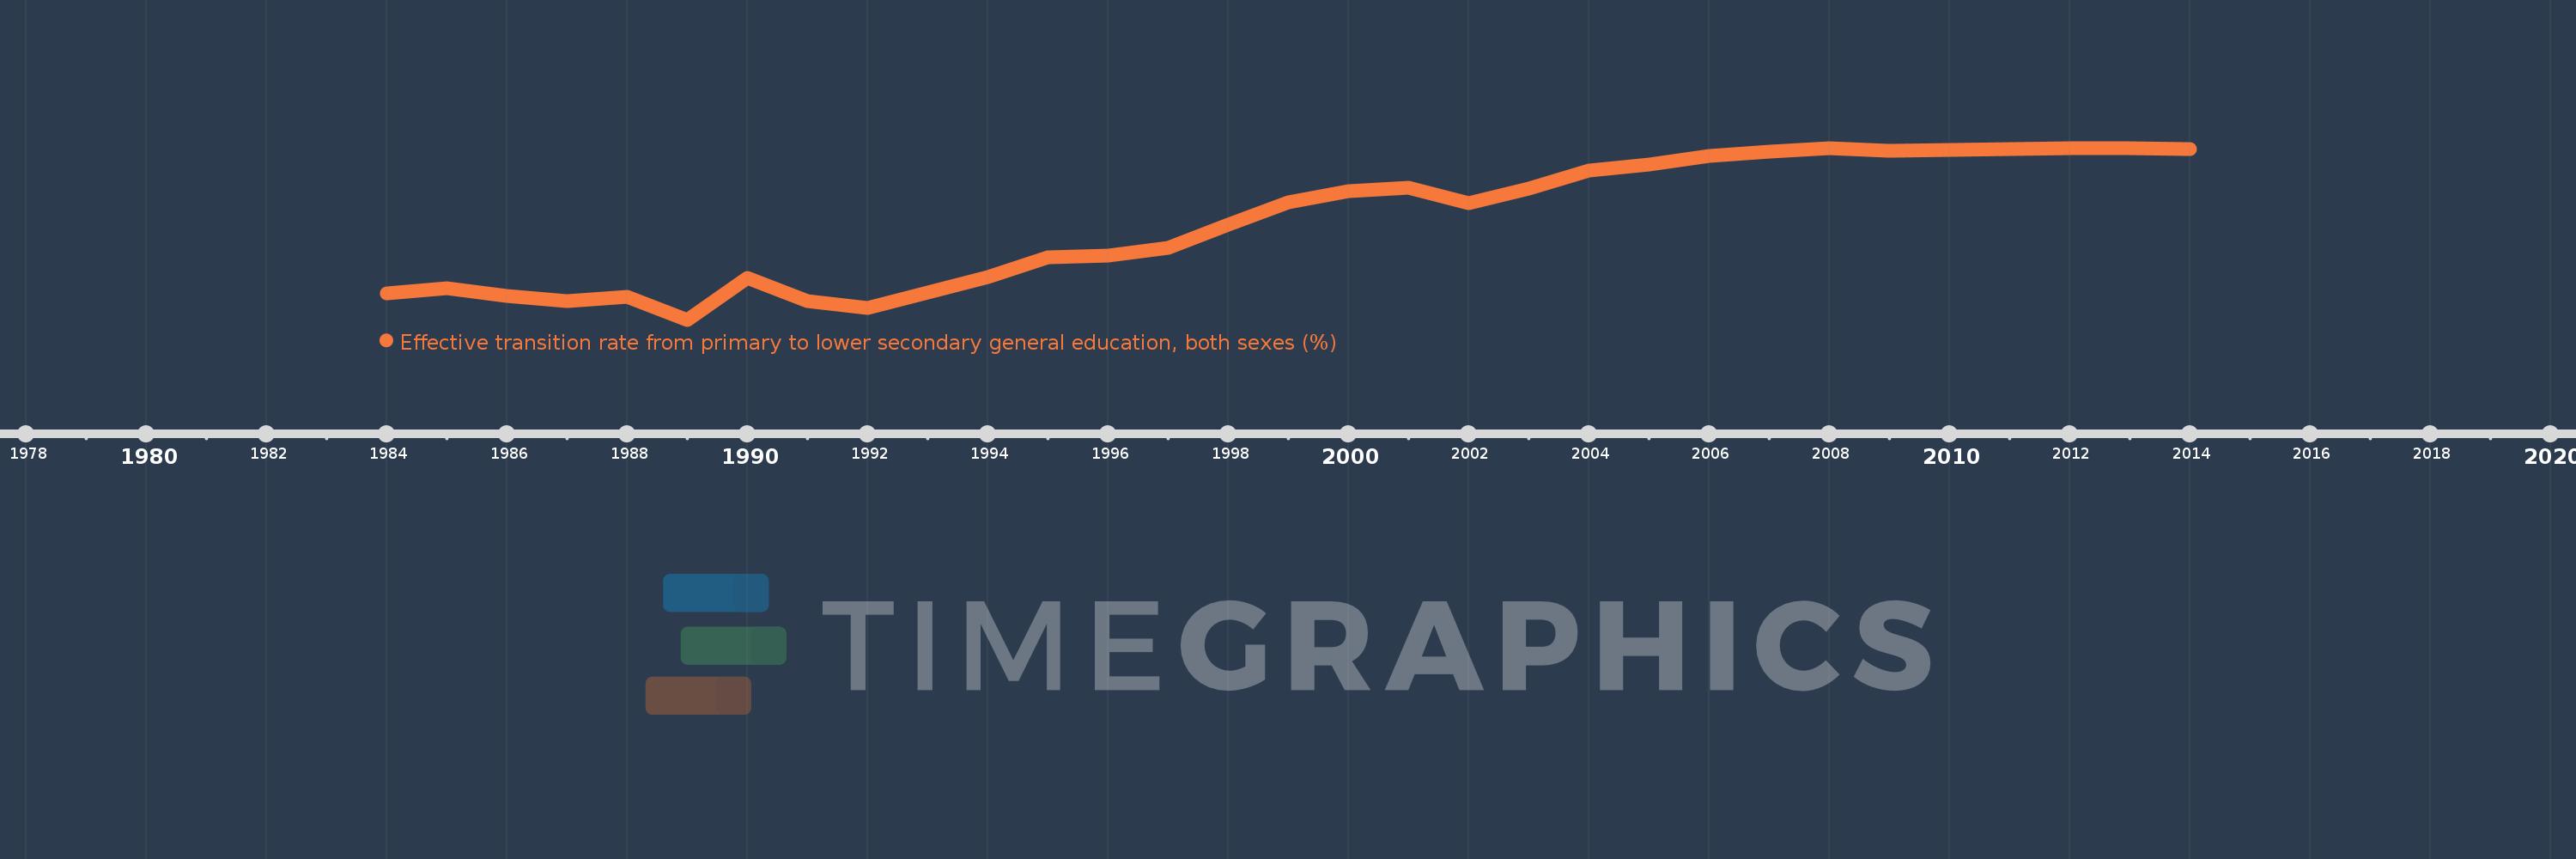
Effective transition rate from primary to lower secondary general education, both sexes (%)
2014,2013,2012,2011,2010,2009,2008,2007,2006,2005,2004,2003,2002,2001,2000,1999,1998,1997,1996,1995,1994,1993,1992,1991,1990,1989,1988,1987,1986,1985,1984
This statistics in other country:
AfghanistanAlbaniaAlgeriaAngolaAntigua and BarbudaArab WorldArgentinaArmeniaArubaAustriaAzerbaijanBahamas, TheBahrainBangladeshBarbadosBelarusBelgiumBelizeBeninBermudaBhutanBoliviaBosnia and HerzegovinaBotswanaBrazilBritish Virgin IslandsBrunei DarussalamBulgariaBurkina FasoBurundiCabo VerdeCambodiaCameroonCaribbean small statesCayman IslandsCentral African RepublicCentral Europe and the BalticsChadChileChinaColombiaComorosCongo, Dem. Rep.Congo, Rep.Costa RicaCote d'IvoireCroatiaCubaCyprusCzech RepublicDenmarkDjiboutiDominicaDominican RepublicEarly-demographic dividendEast Asia & PacificEast Asia & Pacific (excluding high income)East Asia & Pacific (IDA & IBRD countries)EcuadorEgypt, Arab Rep.El SalvadorEquatorial GuineaEritreaEstoniaEthiopiaEuro areaEurope & Central AsiaEurope & Central Asia (excluding high income)Europe & Central Asia (IDA & IBRD countries)European UnionFijiFinlandFragile and conflict affected situationsFranceGabonGambia, TheGeorgiaGermanyGhanaGreeceGrenadaGuatemalaGuineaGuinea-BissauGuyanaHaitiHeavily indebted poor countries (HIPC)High incomeHondurasHong Kong SAR, ChinaHungaryIBRD onlyIcelandIDA & IBRD totalIDA blendIDA onlyIDA totalIndiaIndonesiaIran, Islamic Rep.IraqIsraelItalyJamaicaJapanJordanKazakhstanKenyaKiribatiKorea, Rep.KuwaitKyrgyz RepublicLao PDRLate-demographic dividendLatin America & Caribbean Latin America & Caribbean (excluding high income)Latin America & the Caribbean (IDA & IBRD countries)LatviaLeast developed countries: UN classificationLebanonLesothoLiberiaLibyaLiechtensteinLithuaniaLow & middle incomeLow incomeLower middle incomeLuxembourgMacao SAR, ChinaMacedonia, FYRMadagascarMalawiMalaysiaMaldivesMaliMaltaMarshall IslandsMauritaniaMauritiusMexicoMiddle East & North AfricaMiddle East & North Africa (excluding high income)Middle East & North Africa (IDA & IBRD countries)Middle incomeMoldovaMonacoMongoliaMoroccoMozambiqueMyanmarNamibiaNepalNetherlandsNicaraguaNigerNorwayOECD membersOmanOther small statesPacific island small statesPakistanPalauPanamaParaguayPeruPhilippinesPolandPortugalPost-demographic dividendPre-demographic dividendQatarRomaniaRussian FederationRwandaSamoaSan MarinoSao Tome and PrincipeSaudi ArabiaSenegalSerbiaSeychellesSierra LeoneSingaporeSlovak RepublicSloveniaSmall statesSolomon IslandsSouth AfricaSouth AsiaSouth Asia (IDA & IBRD)SpainSri LankaSt. Kitts and NevisSt. LuciaSt. Vincent and the GrenadinesSub-Saharan Africa Sub-Saharan Africa (excluding high income)Sub-Saharan Africa (IDA & IBRD countries)SudanSurinameSwazilandSwedenSwitzerlandSyrian Arab RepublicTajikistanTanzaniaThailandTimor-LesteTogoTongaTrinidad and TobagoTunisiaTurkeyTurks and Caicos IslandsTuvaluUgandaUkraineUnited Arab EmiratesUpper middle incomeUruguayUzbekistanVanuatuVenezuela, RBVietnamWest Bank and GazaWorldYemen, Rep.ZambiaZimbabwe Timeline:
This timeline shows a graph from 1984 to 2014 of Europe & Central Asia (IDA & IBRD countries). No data until 1983. Number of actual observations by date: 31.
Source name:
World Development Indicators
Source organization:
UNESCO Institute for Statistics
Categories, topics:
Education
Last updated:
apr 23, 2017
Indicators value changes by year
Minimum:
87.253
jan 1, 1989
At the date of observation
Value
Absolute change
Change from previous value
jan 1, 1984
89.098
+89.098
0.0%
jan 1, 1985
89.465
+0.366
0.41%
jan 1, 1986
88.931
-0.534
-0.6%
jan 1, 1987
88.572
-0.359
-0.4%
jan 1, 1988
88.871
+0.299
0.34%
jan 1, 1989
87.253
-1.618
-1.82%
jan 1, 1990
90.205
+2.952
3.38%
jan 1, 1991
88.541
-1.664
-1.84%
jan 1, 1992
88.081
-0.46
-0.52%
jan 1, 1993
89.184
+1.102
1.25%
jan 1, 1994
90.245
+1.061
1.19%
jan 1, 1995
91.595
+1.35
1.5%
jan 1, 1996
91.75
+0.155
0.17%
jan 1, 1997
92.295
+0.545
0.59%
jan 1, 1998
93.913
+1.618
1.75%
jan 1, 1999
95.483
+1.57
1.67%
jan 1, 2000
96.235
+0.752
0.79%
jan 1, 2001
96.484
+0.25
0.26%
jan 1, 2002
95.398
-1.086
-1.13%
jan 1, 2003
96.452
+1.054
1.1%
jan 1, 2004
97.716
+1.265
1.31%
jan 1, 2005
98.14
+0.423
0.43%
jan 1, 2006
98.704
+0.564
0.58%
jan 1, 2007
99.021
+0.316
0.32%
jan 1, 2008
99.226
+0.206
0.21%
jan 1, 2009
99.067
-0.159
-0.16%
jan 1, 2010
99.117
+0.05
0.05%
jan 1, 2011
99.217
+0.1
0.1%
jan 1, 2012
99.27
+0.053
0.05%
jan 1, 2013
99.238
-0.032
-0.03%
jan 1, 2014
99.217
-0.021
-0.02%
Ranking of countries by current statistics by years


Comments: