29
/
en
AIzaSyAYiBZKx7MnpbEhh9jyipgxe19OcubqV5w
April 1, 2024
26811
Early-demographic dividend
EAR
false
2
1
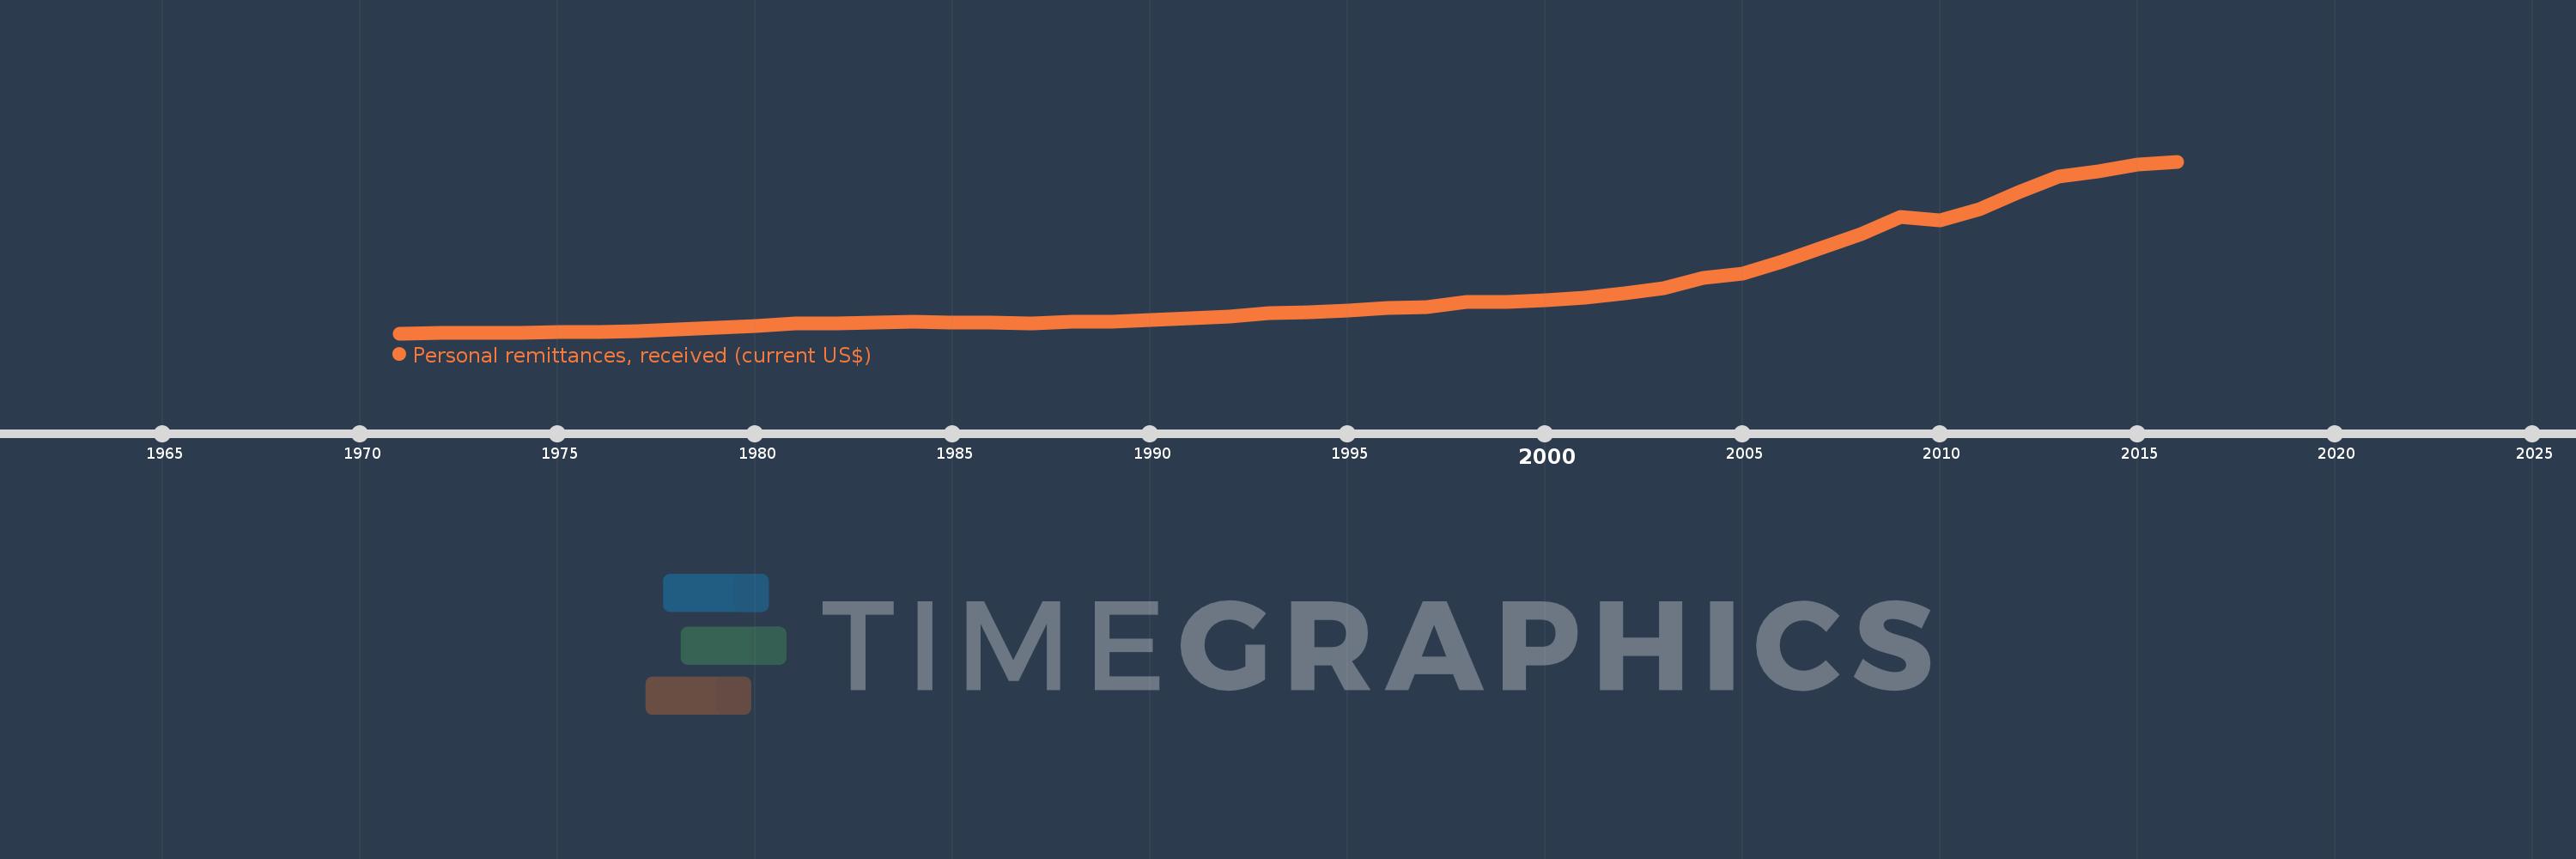
Personal remittances, received (current US$)
2016,2015,2014,2013,2012,2011,2010,2009,2008,2007,2006,2005,2004,2003,2002,2001,2000,1999,1998,1997,1996,1995,1994,1993,1992,1991,1990,1989,1988,1987,1986,1985,1984,1983,1982,1981,1980,1979,1978,1977,1976,1975,1974,1973,1972,1971
This statistics in other country:
AfghanistanAlbaniaAlgeriaAngolaAntigua and BarbudaArab WorldArgentinaArmeniaArubaAustraliaAustriaAzerbaijanBangladeshBarbadosBelarusBelgiumBelizeBeninBermudaBhutanBoliviaBosnia and HerzegovinaBotswanaBrazilBulgariaBurkina FasoBurundiCabo VerdeCambodiaCameroonCanadaCaribbean small statesCentral African RepublicCentral Europe and the BalticsChadChileChinaColombiaComorosCongo, Dem. Rep.Congo, Rep.Costa RicaCote d'IvoireCroatiaCuracaoCyprusCzech RepublicDenmarkDjiboutiDominicaDominican RepublicEarly-demographic dividendEast Asia & PacificEast Asia & Pacific (excluding high income)East Asia & Pacific (IDA & IBRD countries)EcuadorEgypt, Arab Rep.El SalvadorEquatorial GuineaEritreaEstoniaEthiopiaEuro areaEurope & Central AsiaEurope & Central Asia (excluding high income)Europe & Central Asia (IDA & IBRD countries)European UnionFaroe IslandsFijiFinlandFragile and conflict affected situationsFranceFrench PolynesiaGabonGambia, TheGeorgiaGermanyGhanaGreeceGrenadaGuatemalaGuineaGuinea-BissauGuyanaHaitiHeavily indebted poor countries (HIPC)High incomeHondurasHong Kong SAR, ChinaHungaryIBRD onlyIcelandIDA & IBRD totalIDA blendIDA onlyIDA totalIndiaIndonesiaIran, Islamic Rep.IraqIrelandIsraelItalyJamaicaJapanJordanKazakhstanKenyaKiribatiKorea, Rep.KosovoKuwaitKyrgyz RepublicLao PDRLate-demographic dividendLatin America & Caribbean Latin America & Caribbean (excluding high income)Latin America & the Caribbean (IDA & IBRD countries)LatviaLeast developed countries: UN classificationLebanonLesothoLiberiaLibyaLithuaniaLow & middle incomeLow incomeLower middle incomeLuxembourgMacao SAR, ChinaMacedonia, FYRMadagascarMalawiMalaysiaMaldivesMaliMaltaMarshall IslandsMauritaniaMauritiusMexicoMicronesia, Fed. Sts.Middle East & North AfricaMiddle East & North Africa (excluding high income)Middle East & North Africa (IDA & IBRD countries)Middle incomeMoldovaMongoliaMontenegroMoroccoMozambiqueMyanmarNamibiaNepalNetherlandsNew CaledoniaNew ZealandNicaraguaNigerNigeriaNorth AmericaNorwayOECD membersOmanOther small statesPacific island small statesPakistanPalauPanamaPapua New GuineaParaguayPeruPhilippinesPolandPortugalPost-demographic dividendPre-demographic dividendQatarRomaniaRussian FederationRwandaSamoaSao Tome and PrincipeSaudi ArabiaSenegalSerbiaSeychellesSierra LeoneSint Maarten (Dutch part)Slovak RepublicSloveniaSmall statesSolomon IslandsSomaliaSouth AfricaSouth AsiaSouth Asia (IDA & IBRD)South SudanSpainSri LankaSt. Kitts and NevisSt. LuciaSt. Vincent and the GrenadinesSub-Saharan Africa Sub-Saharan Africa (excluding high income)Sub-Saharan Africa (IDA & IBRD countries)SudanSurinameSwazilandSwedenSwitzerlandSyrian Arab RepublicTajikistanTanzaniaThailandTimor-LesteTogoTongaTrinidad and TobagoTunisiaTurkeyTurkmenistanTuvaluUgandaUkraineUnited KingdomUnited StatesUpper middle incomeUruguayUzbekistanVanuatuVenezuela, RBVietnamWest Bank and GazaWorldYemen, Rep.ZambiaZimbabwe Timeline:
This timeline shows a graph from 1971 to 2016 of Early-demographic dividend. No data until 1970. Number of actual observations by date: 46.
Source name:
World Development Indicators
Source organization:
World Bank staff estimates based on IMF balance of payments data.
Categories, topics:
Economy & Growth, Financial Sector, External Debt
Last updated:
apr 23, 2017
Indicators value changes by year
Minimum:
323.5 mln
jan 1, 1971
Maximum:
257.658 bln
jan 1, 2016
At the date of observation
Value
Absolute change
Change from previous value
jan 1, 1971
323.5 mln
+323.5 mln
0.0%
jan 1, 1972
426.572 mln
+103.072 mln
31.86%
jan 1, 1973
501.78 mln
+75.208 mln
17.63%
jan 1, 1974
512.22 mln
+10.44 mln
2.08%
jan 1, 1975
1.917 bln
+1.404 bln
274.16%
jan 1, 1976
2.585 bln
+668.024 mln
34.86%
jan 1, 1977
3.26 bln
+675.828 mln
26.15%
jan 1, 1978
5.892 bln
+2.631 bln
80.7%
jan 1, 1979
8.395 bln
+2.503 bln
42.49%
jan 1, 1980
11.028 bln
+2.633 bln
31.37%
jan 1, 1981
15.066 bln
+4.038 bln
36.62%
jan 1, 1982
15.075 bln
+8.846 mln
0.06%
jan 1, 1983
16.075 bln
+999.589 mln
6.63%
jan 1, 1984
17.302 bln
+1.227 bln
7.64%
jan 1, 1985
16.825 bln
-476.577 mln
-2.75%
jan 1, 1986
15.932 bln
-893.86 mln
-5.31%
jan 1, 1987
15.615 bln
-316.77 mln
-1.99%
jan 1, 1988
18.187 bln
+2.572 bln
16.47%
jan 1, 1989
18.118 bln
-68.707 mln
-0.38%
jan 1, 1990
20.039 bln
+1.921 bln
10.6%
jan 1, 1991
23.138 bln
+3.099 bln
15.46%
jan 1, 1992
25.099 bln
+1.962 bln
8.48%
jan 1, 1993
30.084 bln
+4.985 bln
19.86%
jan 1, 1994
31.49 bln
+1.406 bln
4.67%
jan 1, 1995
34.251 bln
+2.761 bln
8.77%
jan 1, 1996
38.007 bln
+3.756 bln
10.97%
jan 1, 1997
39.946 bln
+1.939 bln
5.1%
jan 1, 1998
46.664 bln
+6.718 bln
16.82%
jan 1, 1999
47.184 bln
+519.709 mln
1.11%
jan 1, 2000
50.393 bln
+3.209 bln
6.8%
jan 1, 2001
54.205 bln
+3.812 bln
7.56%
jan 1, 2002
59.658 bln
+5.453 bln
10.06%
jan 1, 2003
67.79 bln
+8.132 bln
13.63%
jan 1, 2004
82.716 bln
+14.926 bln
22.02%
jan 1, 2005
89.6 bln
+6.884 bln
8.32%
jan 1, 2006
107.367 bln
+17.768 bln
19.83%
jan 1, 2007
128.002 bln
+20.635 bln
19.22%
jan 1, 2008
149.284 bln
+21.282 bln
16.63%
jan 1, 2009
174.122 bln
+24.838 bln
16.64%
jan 1, 2010
168.879 bln
-5.242 bln
-3.01%
jan 1, 2011
185.961 bln
+17.081 bln
10.11%
jan 1, 2012
211.61 bln
+25.649 bln
13.79%
jan 1, 2013
234.904 bln
+23.294 bln
11.01%
jan 1, 2014
242.849 bln
+7.945 bln
3.38%
jan 1, 2015
253.601 bln
+10.751 bln
4.43%
jan 1, 2016
257.658 bln
+4.057 bln
1.6%
Ranking of countries by current statistics by years


Comments: