29
/
en
AIzaSyAYiBZKx7MnpbEhh9jyipgxe19OcubqV5w
April 1, 2024
167976
Kenya
KEN
true
2
1
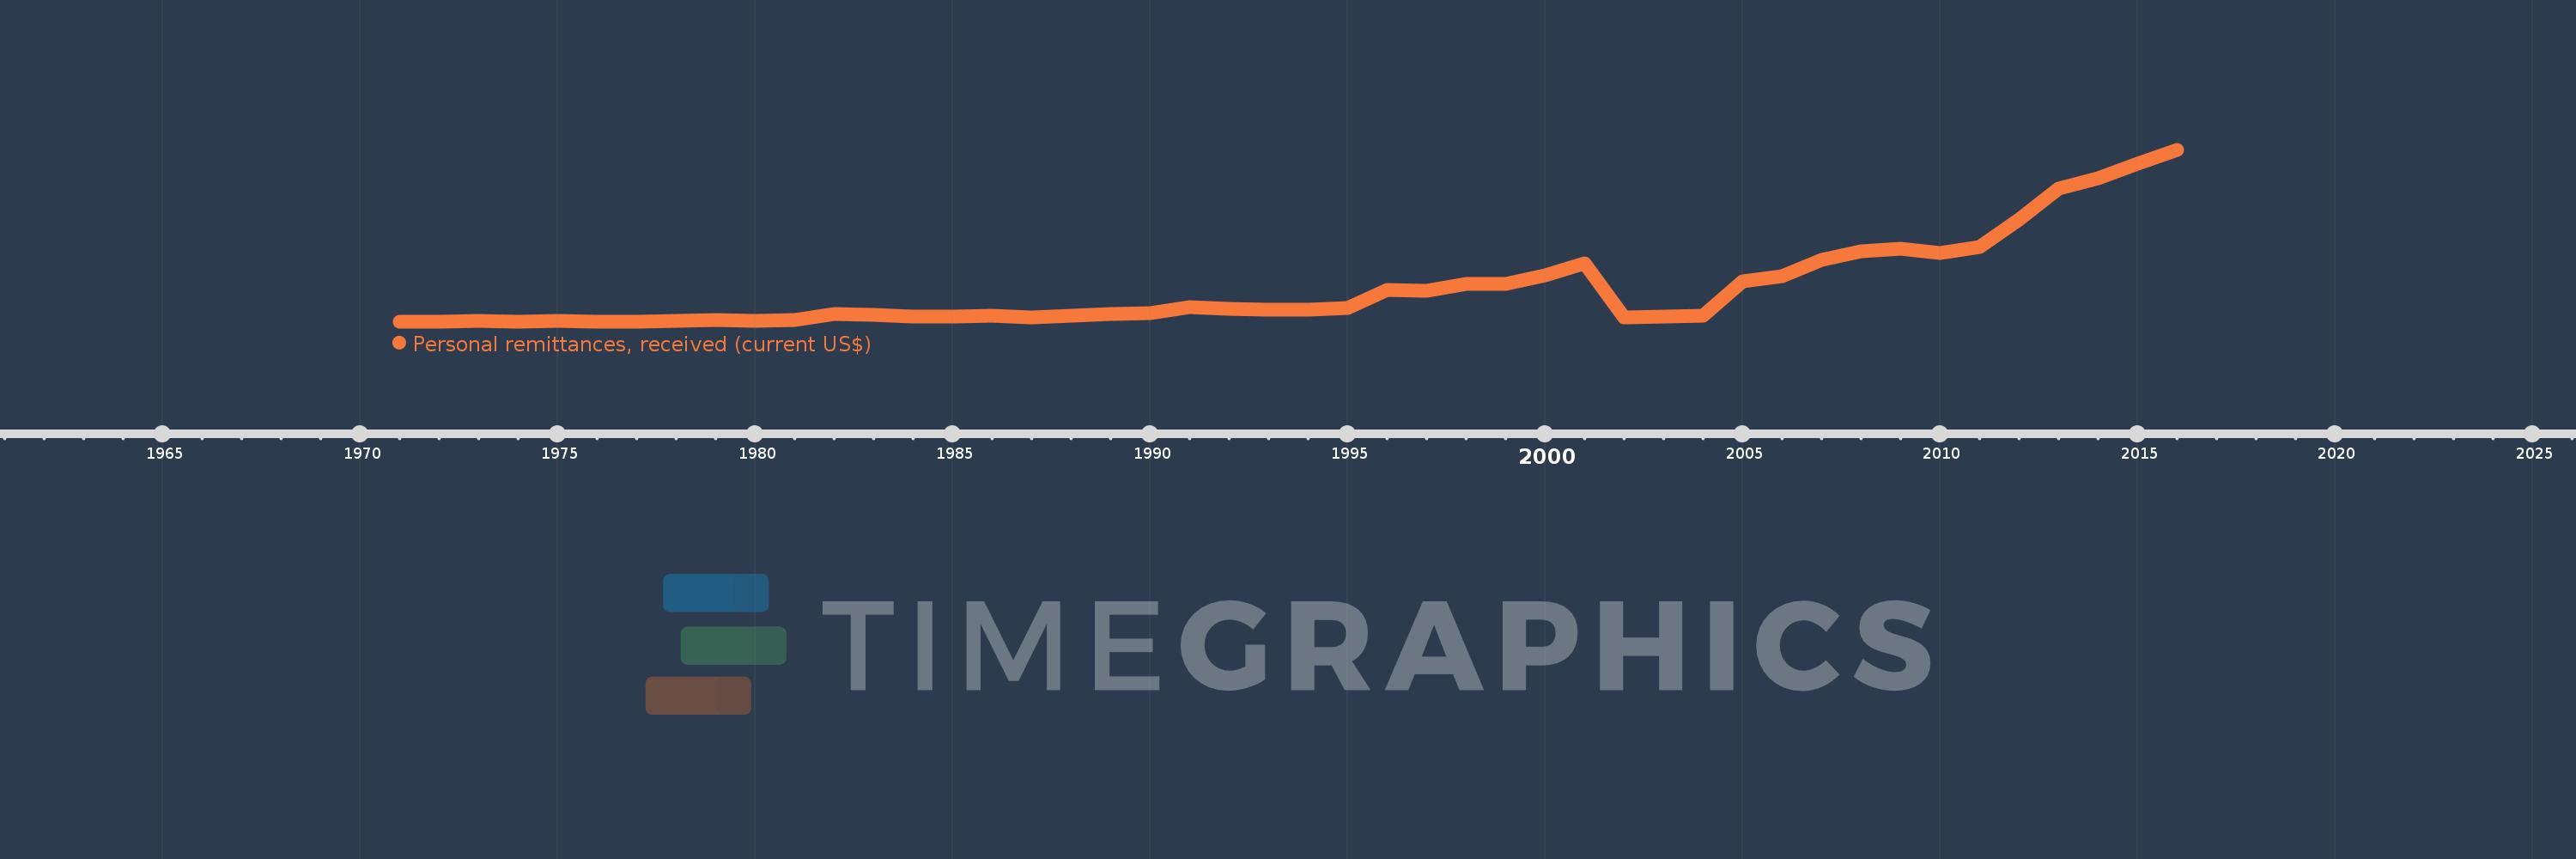
Personal remittances, received (current US$)
2016,2015,2014,2013,2012,2011,2010,2009,2008,2007,2006,2005,2004,2003,2002,2001,2000,1999,1998,1997,1996,1995,1994,1993,1992,1991,1990,1989,1988,1987,1986,1985,1984,1983,1982,1981,1980,1979,1978,1977,1976,1975,1974,1973,1972,1971
This statistics in other country:
AfghanistanAlbaniaAlgeriaAngolaAntigua and BarbudaArab WorldArgentinaArmeniaArubaAustraliaAustriaAzerbaijanBangladeshBarbadosBelarusBelgiumBelizeBeninBermudaBhutanBoliviaBosnia and HerzegovinaBotswanaBrazilBulgariaBurkina FasoBurundiCabo VerdeCambodiaCameroonCanadaCaribbean small statesCentral African RepublicCentral Europe and the BalticsChadChileChinaColombiaComorosCongo, Dem. Rep.Congo, Rep.Costa RicaCote d'IvoireCroatiaCuracaoCyprusCzech RepublicDenmarkDjiboutiDominicaDominican RepublicEarly-demographic dividendEast Asia & PacificEast Asia & Pacific (excluding high income)East Asia & Pacific (IDA & IBRD countries)EcuadorEgypt, Arab Rep.El SalvadorEquatorial GuineaEritreaEstoniaEthiopiaEuro areaEurope & Central AsiaEurope & Central Asia (excluding high income)Europe & Central Asia (IDA & IBRD countries)European UnionFaroe IslandsFijiFinlandFragile and conflict affected situationsFranceFrench PolynesiaGabonGambia, TheGeorgiaGermanyGhanaGreeceGrenadaGuatemalaGuineaGuinea-BissauGuyanaHaitiHeavily indebted poor countries (HIPC)High incomeHondurasHong Kong SAR, ChinaHungaryIBRD onlyIcelandIDA & IBRD totalIDA blendIDA onlyIDA totalIndiaIndonesiaIran, Islamic Rep.IraqIrelandIsraelItalyJamaicaJapanJordanKazakhstanKenyaKiribatiKorea, Rep.KosovoKuwaitKyrgyz RepublicLao PDRLate-demographic dividendLatin America & Caribbean Latin America & Caribbean (excluding high income)Latin America & the Caribbean (IDA & IBRD countries)LatviaLeast developed countries: UN classificationLebanonLesothoLiberiaLibyaLithuaniaLow & middle incomeLow incomeLower middle incomeLuxembourgMacao SAR, ChinaMacedonia, FYRMadagascarMalawiMalaysiaMaldivesMaliMaltaMarshall IslandsMauritaniaMauritiusMexicoMicronesia, Fed. Sts.Middle East & North AfricaMiddle East & North Africa (excluding high income)Middle East & North Africa (IDA & IBRD countries)Middle incomeMoldovaMongoliaMontenegroMoroccoMozambiqueMyanmarNamibiaNepalNetherlandsNew CaledoniaNew ZealandNicaraguaNigerNigeriaNorth AmericaNorwayOECD membersOmanOther small statesPacific island small statesPakistanPalauPanamaPapua New GuineaParaguayPeruPhilippinesPolandPortugalPost-demographic dividendPre-demographic dividendQatarRomaniaRussian FederationRwandaSamoaSao Tome and PrincipeSaudi ArabiaSenegalSerbiaSeychellesSierra LeoneSint Maarten (Dutch part)Slovak RepublicSloveniaSmall statesSolomon IslandsSomaliaSouth AfricaSouth AsiaSouth Asia (IDA & IBRD)South SudanSpainSri LankaSt. Kitts and NevisSt. LuciaSt. Vincent and the GrenadinesSub-Saharan Africa Sub-Saharan Africa (excluding high income)Sub-Saharan Africa (IDA & IBRD countries)SudanSurinameSwazilandSwedenSwitzerlandSyrian Arab RepublicTajikistanTanzaniaThailandTimor-LesteTogoTongaTrinidad and TobagoTunisiaTurkeyTurkmenistanTuvaluUgandaUkraineUnited KingdomUnited StatesUpper middle incomeUruguayUzbekistanVanuatuVenezuela, RBVietnamWest Bank and GazaWorldYemen, Rep.ZambiaZimbabwe Timeline:
This timeline shows a graph from 1971 to 2016 of Kenya. No data until 1970. Number of actual observations by date: 46.
Source name:
World Development Indicators
Source organization:
World Bank staff estimates based on IMF balance of payments data.
Categories, topics:
Economy & Growth, Financial Sector, External Debt
Last updated:
apr 23, 2017
Indicators value changes by year
Minimum:
7.26 mln
jan 1, 1971
Maximum:
1.56 bln
jan 1, 2016
At the date of observation
Value
Absolute change
Change from previous value
jan 1, 1971
7.26 mln
+7.26 mln
0.0%
jan 1, 1972
7.26 mln
0.0
0.0%
jan 1, 1973
13.86 mln
+6.6 mln
90.91%
jan 1, 1974
12.54 mln
-1.32 mln
-9.52%
jan 1, 1975
18.48 mln
+5.94 mln
47.37%
jan 1, 1976
13.2 mln
-5.28 mln
-28.57%
jan 1, 1977
9.9 mln
-3.3 mln
-25.0%
jan 1, 1978
18.48 mln
+8.58 mln
86.67%
jan 1, 1979
26.4 mln
+7.92 mln
42.86%
jan 1, 1980
19.14 mln
-7.26 mln
-27.5%
jan 1, 1981
27.72 mln
+8.58 mln
44.83%
jan 1, 1982
78.54 mln
+50.82 mln
183.33%
jan 1, 1983
67.98 mln
-10.56 mln
-13.45%
jan 1, 1984
58.08 mln
-9.9 mln
-14.56%
jan 1, 1985
56.76 mln
-1.32 mln
-2.27%
jan 1, 1986
66.0 mln
+9.24 mln
16.28%
jan 1, 1987
52.14 mln
-13.86 mln
-21.0%
jan 1, 1988
66.0 mln
+13.86 mln
26.58%
jan 1, 1989
76.56 mln
+10.56 mln
16.0%
jan 1, 1990
89.1 mln
+12.54 mln
16.38%
jan 1, 1991
139.26 mln
+50.16 mln
56.3%
jan 1, 1992
124.08 mln
-15.18 mln
-10.9%
jan 1, 1993
114.84 mln
-9.24 mln
-7.45%
jan 1, 1994
118.14 mln
+3.3 mln
2.87%
jan 1, 1995
137.28 mln
+19.14 mln
16.2%
jan 1, 1996
298.32 mln
+161.04 mln
117.31%
jan 1, 1997
288.42 mln
-9.9 mln
-3.32%
jan 1, 1998
351.78 mln
+63.36 mln
21.97%
jan 1, 1999
347.82 mln
-3.96 mln
-1.13%
jan 1, 2000
431.64 mln
+83.82 mln
24.1%
jan 1, 2001
537.9 mln
+106.26 mln
24.62%
jan 1, 2002
50.914 mln
-486.986 mln
-90.53%
jan 1, 2003
57.143 mln
+6.229 mln
12.23%
jan 1, 2004
65.845 mln
+8.702 mln
15.23%
jan 1, 2005
375.811 mln
+309.966 mln
470.75%
jan 1, 2006
424.991 mln
+49.18 mln
13.09%
jan 1, 2007
570.459 mln
+145.468 mln
34.23%
jan 1, 2008
645.208 mln
+74.749 mln
13.1%
jan 1, 2009
667.317 mln
+22.109 mln
3.43%
jan 1, 2010
631.461 mln
-35.856 mln
-5.37%
jan 1, 2011
685.757 mln
+54.296 mln
8.6%
jan 1, 2012
934.149 mln
+248.392 mln
36.22%
jan 1, 2013
1.211 bln
+276.872 mln
29.64%
jan 1, 2014
1.304 bln
+93.256 mln
7.7%
jan 1, 2015
1.441 bln
+136.569 mln
10.47%
jan 1, 2016
1.56 bln
+119.575 mln
8.3%
Ranking of countries by current statistics by years


Comments: