29
/
en
AIzaSyAYiBZKx7MnpbEhh9jyipgxe19OcubqV5w
April 1, 2024
213431
Nigeria
NGA
true
2
1
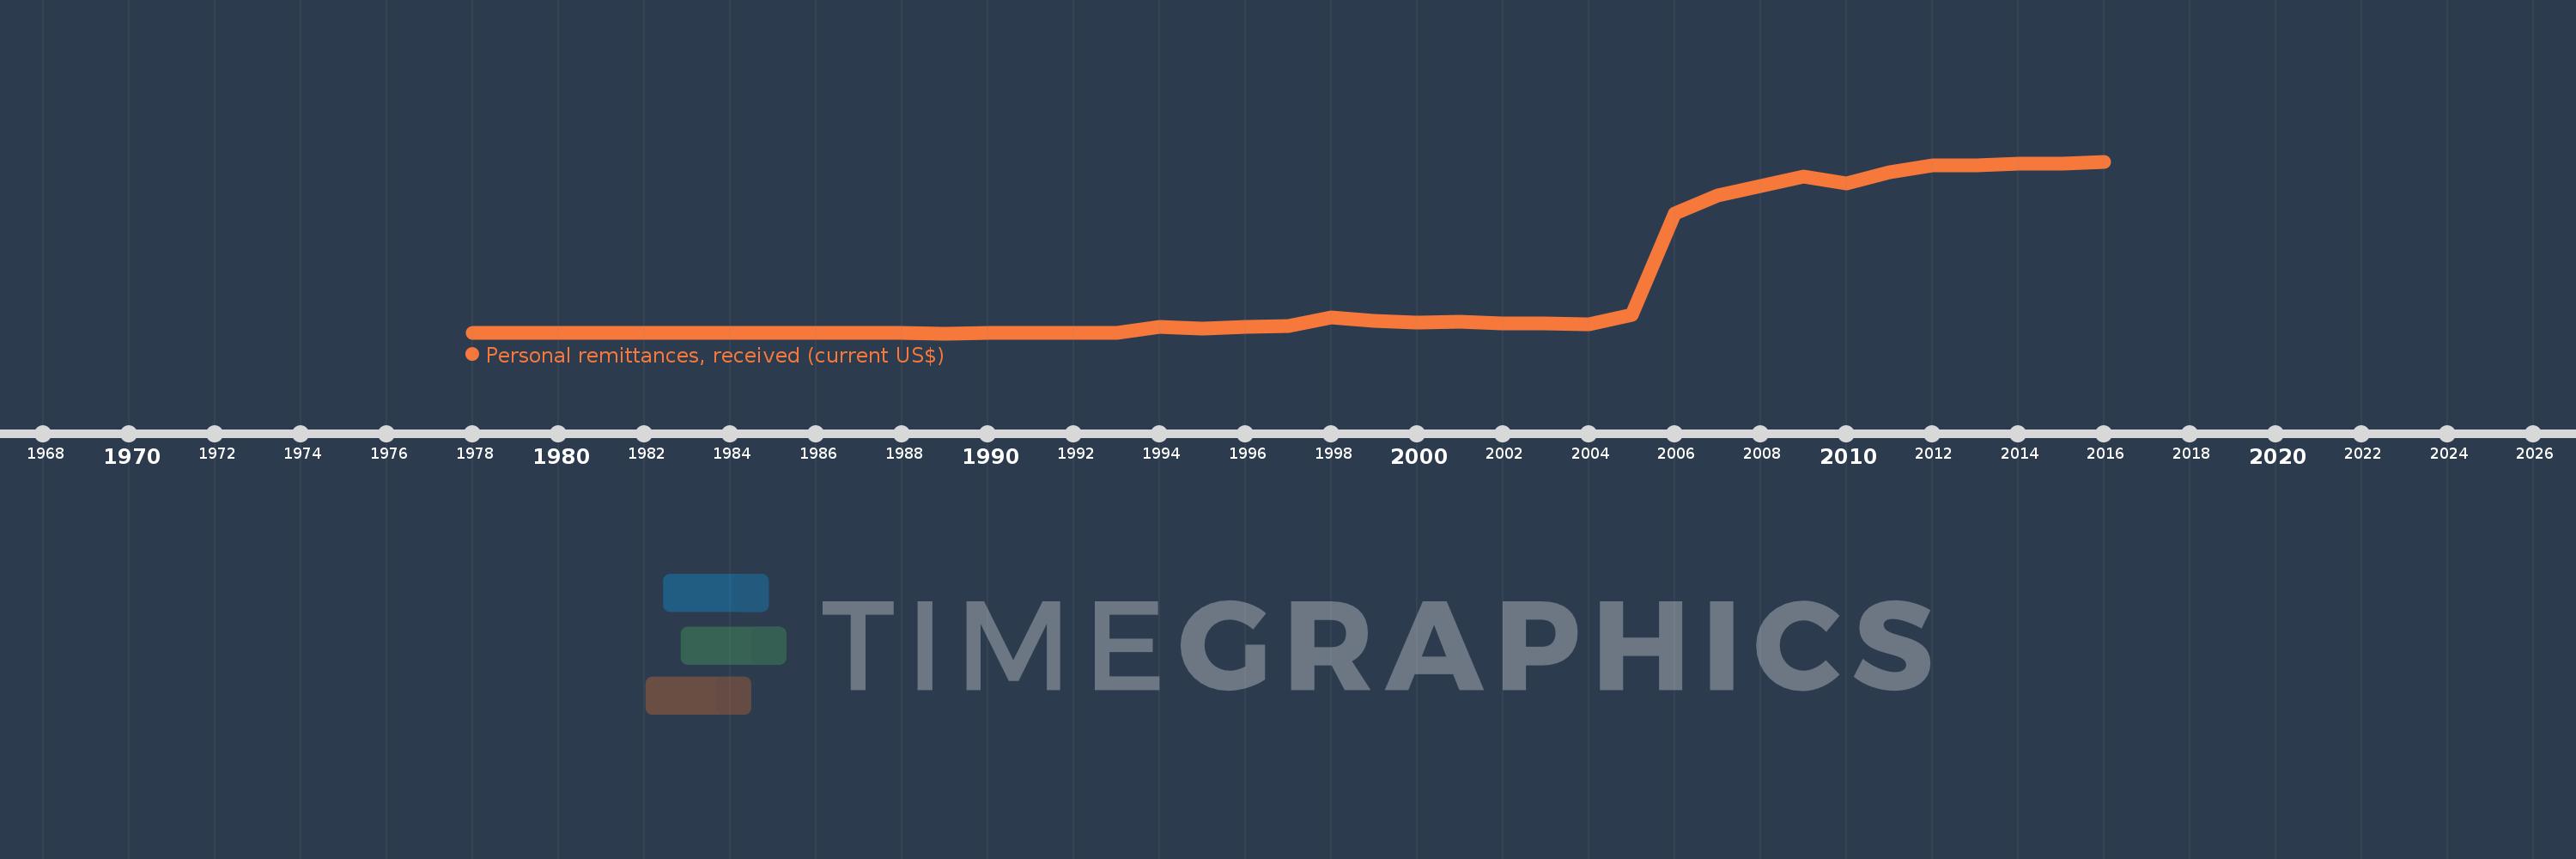
Personal remittances, received (current US$)
2016,2015,2014,2013,2012,2011,2010,2009,2008,2007,2006,2005,2004,2003,2002,2001,2000,1999,1998,1997,1996,1995,1994,1993,1992,1991,1990,1989,1988,1987,1986,1985,1984,1983,1982,1981,1980,1979,1978
This statistics in other country:
AfghanistanAlbaniaAlgeriaAngolaAntigua and BarbudaArab WorldArgentinaArmeniaArubaAustraliaAustriaAzerbaijanBangladeshBarbadosBelarusBelgiumBelizeBeninBermudaBhutanBoliviaBosnia and HerzegovinaBotswanaBrazilBulgariaBurkina FasoBurundiCabo VerdeCambodiaCameroonCanadaCaribbean small statesCentral African RepublicCentral Europe and the BalticsChadChileChinaColombiaComorosCongo, Dem. Rep.Congo, Rep.Costa RicaCote d'IvoireCroatiaCuracaoCyprusCzech RepublicDenmarkDjiboutiDominicaDominican RepublicEarly-demographic dividendEast Asia & PacificEast Asia & Pacific (excluding high income)East Asia & Pacific (IDA & IBRD countries)EcuadorEgypt, Arab Rep.El SalvadorEquatorial GuineaEritreaEstoniaEthiopiaEuro areaEurope & Central AsiaEurope & Central Asia (excluding high income)Europe & Central Asia (IDA & IBRD countries)European UnionFaroe IslandsFijiFinlandFragile and conflict affected situationsFranceFrench PolynesiaGabonGambia, TheGeorgiaGermanyGhanaGreeceGrenadaGuatemalaGuineaGuinea-BissauGuyanaHaitiHeavily indebted poor countries (HIPC)High incomeHondurasHong Kong SAR, ChinaHungaryIBRD onlyIcelandIDA & IBRD totalIDA blendIDA onlyIDA totalIndiaIndonesiaIran, Islamic Rep.IraqIrelandIsraelItalyJamaicaJapanJordanKazakhstanKenyaKiribatiKorea, Rep.KosovoKuwaitKyrgyz RepublicLao PDRLate-demographic dividendLatin America & Caribbean Latin America & Caribbean (excluding high income)Latin America & the Caribbean (IDA & IBRD countries)LatviaLeast developed countries: UN classificationLebanonLesothoLiberiaLibyaLithuaniaLow & middle incomeLow incomeLower middle incomeLuxembourgMacao SAR, ChinaMacedonia, FYRMadagascarMalawiMalaysiaMaldivesMaliMaltaMarshall IslandsMauritaniaMauritiusMexicoMicronesia, Fed. Sts.Middle East & North AfricaMiddle East & North Africa (excluding high income)Middle East & North Africa (IDA & IBRD countries)Middle incomeMoldovaMongoliaMontenegroMoroccoMozambiqueMyanmarNamibiaNepalNetherlandsNew CaledoniaNew ZealandNicaraguaNigerNigeriaNorth AmericaNorwayOECD membersOmanOther small statesPacific island small statesPakistanPalauPanamaPapua New GuineaParaguayPeruPhilippinesPolandPortugalPost-demographic dividendPre-demographic dividendQatarRomaniaRussian FederationRwandaSamoaSao Tome and PrincipeSaudi ArabiaSenegalSerbiaSeychellesSierra LeoneSint Maarten (Dutch part)Slovak RepublicSloveniaSmall statesSolomon IslandsSomaliaSouth AfricaSouth AsiaSouth Asia (IDA & IBRD)South SudanSpainSri LankaSt. Kitts and NevisSt. LuciaSt. Vincent and the GrenadinesSub-Saharan Africa Sub-Saharan Africa (excluding high income)Sub-Saharan Africa (IDA & IBRD countries)SudanSurinameSwazilandSwedenSwitzerlandSyrian Arab RepublicTajikistanTanzaniaThailandTimor-LesteTogoTongaTrinidad and TobagoTunisiaTurkeyTurkmenistanTuvaluUgandaUkraineUnited KingdomUnited StatesUpper middle incomeUruguayUzbekistanVanuatuVenezuela, RBVietnamWest Bank and GazaWorldYemen, Rep.ZambiaZimbabwe Timeline:
This timeline shows a graph from 1978 to 2016 of Nigeria. No data until 1977. Number of actual observations by date: 39.
Source name:
World Development Indicators
Source organization:
World Bank staff estimates based on IMF balance of payments data.
Categories, topics:
Economy & Growth, Financial Sector, External Debt
Last updated:
apr 23, 2017
Indicators value changes by year
Minimum:
2.0 mln
jan 1, 1989
Maximum:
21.06 bln
jan 1, 2016
At the date of observation
Value
Absolute change
Change from previous value
jan 1, 1978
20.0 mln
+20.0 mln
0.0%
jan 1, 1979
3.0 mln
-17.0 mln
-85.0%
jan 1, 1980
8.0 mln
+5.0 mln
166.67%
jan 1, 1981
22.0 mln
+14.0 mln
175.0%
jan 1, 1982
16.0 mln
-6.0 mln
-27.27%
jan 1, 1983
18.0 mln
+2.0 mln
12.5%
jan 1, 1984
14.0 mln
-4.0 mln
-22.22%
jan 1, 1985
12.0 mln
-2.0 mln
-14.29%
jan 1, 1986
10.0 mln
-2.0 mln
-16.67%
jan 1, 1987
4.0 mln
-6.0 mln
-60.0%
jan 1, 1988
3.0 mln
-1000.0K
-25.0%
jan 1, 1989
2.0 mln
-1000.0K
-33.33%
jan 1, 1990
10.0 mln
+8.0 mln
400.0%
jan 1, 1991
10.0 mln
0.0
0.0%
jan 1, 1992
66.0 mln
+56.0 mln
560.0%
jan 1, 1993
56.0 mln
-10.0 mln
-15.15%
jan 1, 1994
793.0 mln
+737.0 mln
1.32K%
jan 1, 1995
550.0 mln
-243.0 mln
-30.64%
jan 1, 1996
804.0 mln
+254.0 mln
46.18%
jan 1, 1997
947.0 mln
+143.0 mln
17.79%
jan 1, 1998
1.92 bln
+973.0 mln
102.75%
jan 1, 1999
1.544 bln
-376.0 mln
-19.58%
jan 1, 2000
1.301 bln
-243.0 mln
-15.74%
jan 1, 2001
1.392 bln
+90.79 mln
6.98%
jan 1, 2002
1.167 bln
-225.162 mln
-16.18%
jan 1, 2003
1.209 bln
+42.312 mln
3.63%
jan 1, 2004
1.063 bln
-146.1 mln
-12.08%
jan 1, 2005
2.273 bln
+1.21 bln
113.83%
jan 1, 2006
14.64 bln
+12.367 bln
544.17%
jan 1, 2007
16.932 bln
+2.292 bln
15.66%
jan 1, 2008
18.011 bln
+1.079 bln
6.37%
jan 1, 2009
19.206 bln
+1.195 bln
6.63%
jan 1, 2010
18.368 bln
-837.584 mln
-4.36%
jan 1, 2011
19.745 bln
+1.376 bln
7.49%
jan 1, 2012
20.617 bln
+872.206 mln
4.42%
jan 1, 2013
20.543 bln
-73.933 mln
-0.36%
jan 1, 2014
20.797 bln
+254.173 mln
1.24%
jan 1, 2015
20.829 bln
+32.041 mln
0.15%
jan 1, 2016
21.06 bln
+230.527 mln
1.11%
Ranking of countries by current statistics by years


Comments: