29
/
en
AIzaSyAYiBZKx7MnpbEhh9jyipgxe19OcubqV5w
April 1, 2024
202057
Morocco
MAR
true
2
1
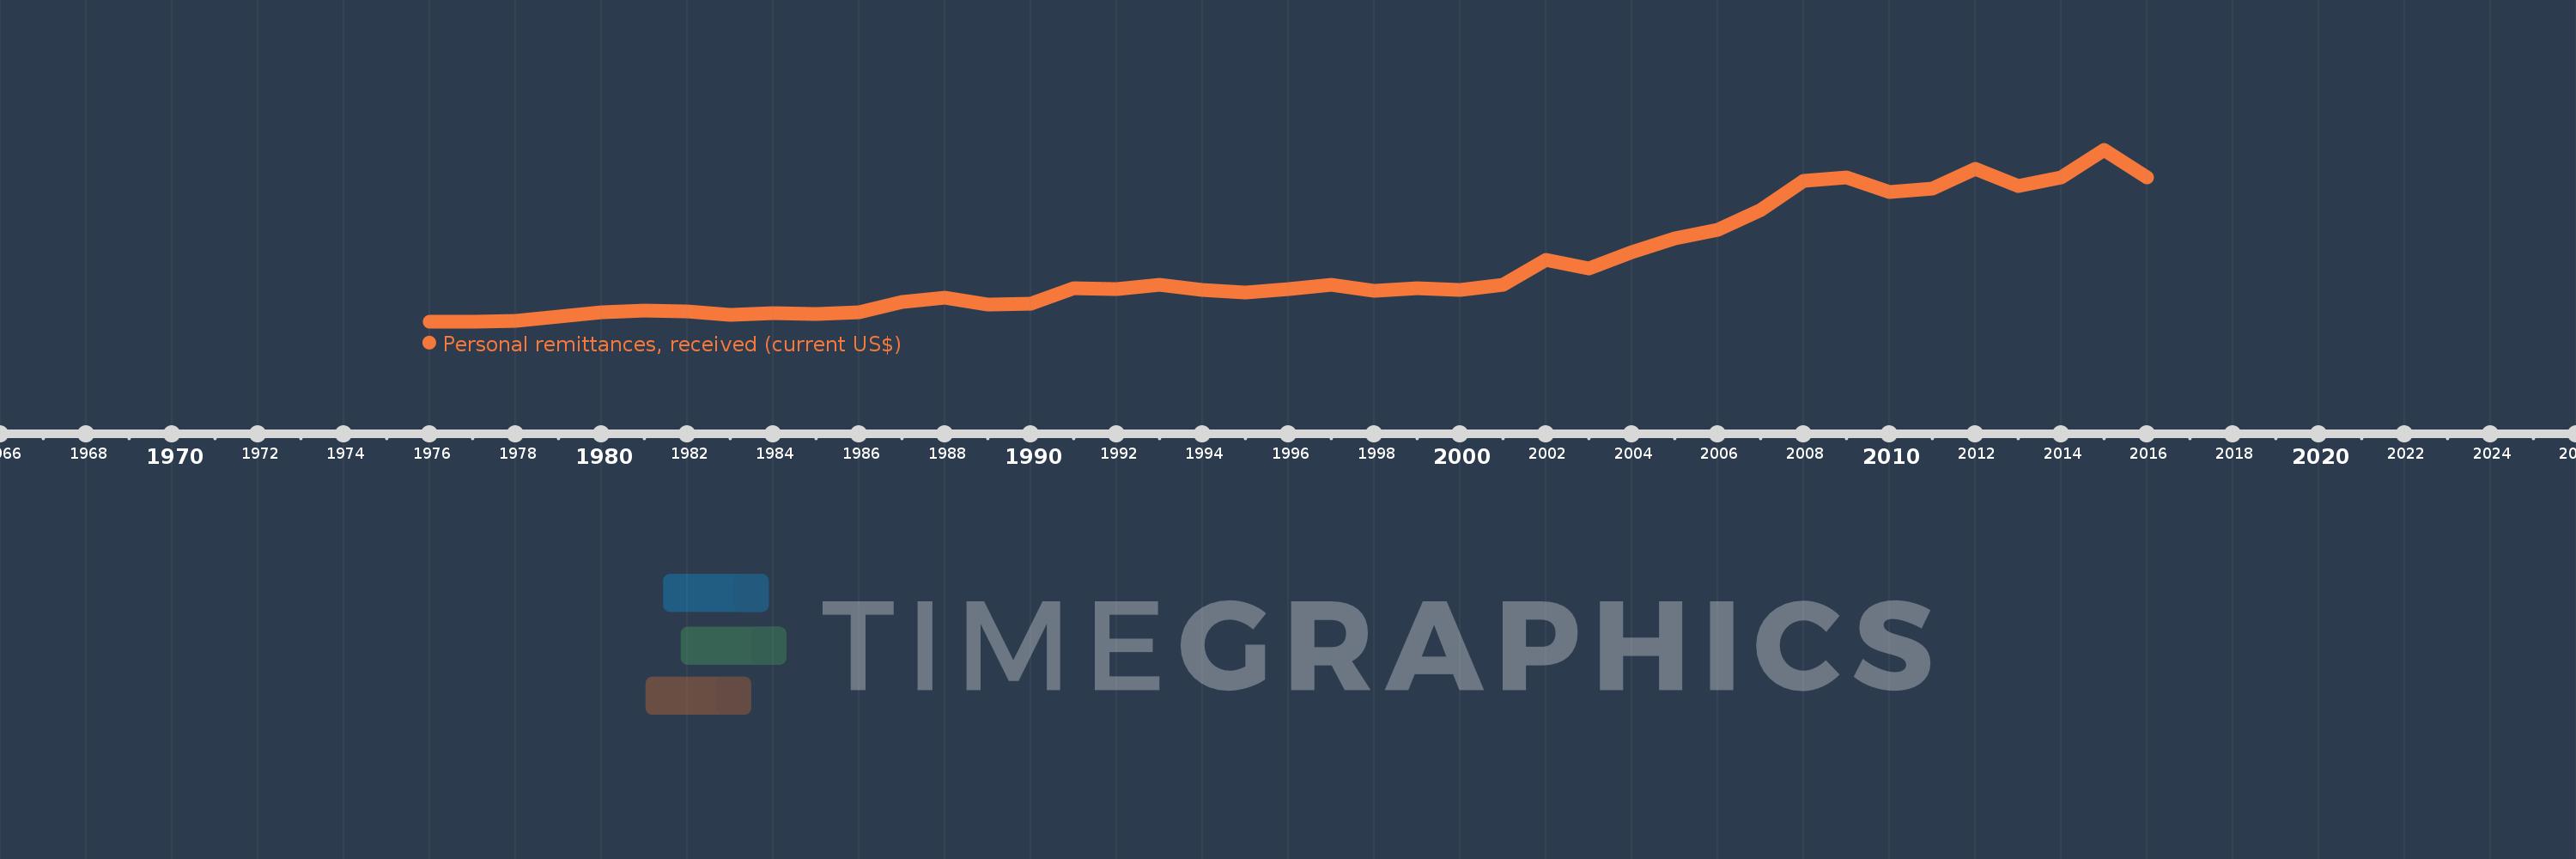
Personal remittances, received (current US$)
2016,2015,2014,2013,2012,2011,2010,2009,2008,2007,2006,2005,2004,2003,2002,2001,2000,1999,1998,1997,1996,1995,1994,1993,1992,1991,1990,1989,1988,1987,1986,1985,1984,1983,1982,1981,1980,1979,1978,1977,1976
This statistics in other country:
AfghanistanAlbaniaAlgeriaAngolaAntigua and BarbudaArab WorldArgentinaArmeniaArubaAustraliaAustriaAzerbaijanBangladeshBarbadosBelarusBelgiumBelizeBeninBermudaBhutanBoliviaBosnia and HerzegovinaBotswanaBrazilBulgariaBurkina FasoBurundiCabo VerdeCambodiaCameroonCanadaCaribbean small statesCentral African RepublicCentral Europe and the BalticsChadChileChinaColombiaComorosCongo, Dem. Rep.Congo, Rep.Costa RicaCote d'IvoireCroatiaCuracaoCyprusCzech RepublicDenmarkDjiboutiDominicaDominican RepublicEarly-demographic dividendEast Asia & PacificEast Asia & Pacific (excluding high income)East Asia & Pacific (IDA & IBRD countries)EcuadorEgypt, Arab Rep.El SalvadorEquatorial GuineaEritreaEstoniaEthiopiaEuro areaEurope & Central AsiaEurope & Central Asia (excluding high income)Europe & Central Asia (IDA & IBRD countries)European UnionFaroe IslandsFijiFinlandFragile and conflict affected situationsFranceFrench PolynesiaGabonGambia, TheGeorgiaGermanyGhanaGreeceGrenadaGuatemalaGuineaGuinea-BissauGuyanaHaitiHeavily indebted poor countries (HIPC)High incomeHondurasHong Kong SAR, ChinaHungaryIBRD onlyIcelandIDA & IBRD totalIDA blendIDA onlyIDA totalIndiaIndonesiaIran, Islamic Rep.IraqIrelandIsraelItalyJamaicaJapanJordanKazakhstanKenyaKiribatiKorea, Rep.KosovoKuwaitKyrgyz RepublicLao PDRLate-demographic dividendLatin America & Caribbean Latin America & Caribbean (excluding high income)Latin America & the Caribbean (IDA & IBRD countries)LatviaLeast developed countries: UN classificationLebanonLesothoLiberiaLibyaLithuaniaLow & middle incomeLow incomeLower middle incomeLuxembourgMacao SAR, ChinaMacedonia, FYRMadagascarMalawiMalaysiaMaldivesMaliMaltaMarshall IslandsMauritaniaMauritiusMexicoMicronesia, Fed. Sts.Middle East & North AfricaMiddle East & North Africa (excluding high income)Middle East & North Africa (IDA & IBRD countries)Middle incomeMoldovaMongoliaMontenegroMoroccoMozambiqueMyanmarNamibiaNepalNetherlandsNew CaledoniaNew ZealandNicaraguaNigerNigeriaNorth AmericaNorwayOECD membersOmanOther small statesPacific island small statesPakistanPalauPanamaPapua New GuineaParaguayPeruPhilippinesPolandPortugalPost-demographic dividendPre-demographic dividendQatarRomaniaRussian FederationRwandaSamoaSao Tome and PrincipeSaudi ArabiaSenegalSerbiaSeychellesSierra LeoneSint Maarten (Dutch part)Slovak RepublicSloveniaSmall statesSolomon IslandsSomaliaSouth AfricaSouth AsiaSouth Asia (IDA & IBRD)South SudanSpainSri LankaSt. Kitts and NevisSt. LuciaSt. Vincent and the GrenadinesSub-Saharan Africa Sub-Saharan Africa (excluding high income)Sub-Saharan Africa (IDA & IBRD countries)SudanSurinameSwazilandSwedenSwitzerlandSyrian Arab RepublicTajikistanTanzaniaThailandTimor-LesteTogoTongaTrinidad and TobagoTunisiaTurkeyTurkmenistanTuvaluUgandaUkraineUnited KingdomUnited StatesUpper middle incomeUruguayUzbekistanVanuatuVenezuela, RBVietnamWest Bank and GazaWorldYemen, Rep.ZambiaZimbabwe Timeline:
This timeline shows a graph from 1976 to 2016 of Morocco. No data until 1975. Number of actual observations by date: 41.
Source name:
World Development Indicators
Source organization:
World Bank staff estimates based on IMF balance of payments data.
Categories, topics:
Economy & Growth, Financial Sector, External Debt
Last updated:
apr 23, 2017
Indicators value changes by year
Minimum:
533.006 mln
jan 1, 1976
Maximum:
8.094 bln
jan 1, 2015
At the date of observation
Value
Absolute change
Change from previous value
jan 1, 1976
533.006 mln
+533.006 mln
0.0%
jan 1, 1977
547.144 mln
+14.138 mln
2.65%
jan 1, 1978
589.562 mln
+42.418 mln
7.75%
jan 1, 1979
763.199 mln
+173.638 mln
29.45%
jan 1, 1980
948.416 mln
+185.216 mln
24.27%
jan 1, 1981
1.054 bln
+105.527 mln
11.13%
jan 1, 1982
1.014 bln
-40.08 mln
-3.8%
jan 1, 1983
849.573 mln
-164.29 mln
-16.2%
jan 1, 1984
916.988 mln
+67.415 mln
7.94%
jan 1, 1985
873.727 mln
-43.262 mln
-4.72%
jan 1, 1986
972.522 mln
+98.796 mln
11.31%
jan 1, 1987
1.4 bln
+427.124 mln
43.92%
jan 1, 1988
1.589 bln
+189.257 mln
13.52%
jan 1, 1989
1.305 bln
-284.262 mln
-17.89%
jan 1, 1990
1.337 bln
+31.924 mln
2.45%
jan 1, 1991
2.006 bln
+669.781 mln
50.11%
jan 1, 1992
1.99 bln
-16.007 mln
-0.8%
jan 1, 1993
2.17 bln
+180.106 mln
9.05%
jan 1, 1994
1.959 bln
-211.357 mln
-9.74%
jan 1, 1995
1.827 bln
-131.694 mln
-6.72%
jan 1, 1996
1.97 bln
+142.105 mln
7.78%
jan 1, 1997
2.165 bln
+195.973 mln
9.95%
jan 1, 1998
1.893 bln
-272.139 mln
-12.57%
jan 1, 1999
2.011 bln
+117.407 mln
6.2%
jan 1, 2000
1.938 bln
-72.432 mln
-3.6%
jan 1, 2001
2.161 bln
+222.653 mln
11.49%
jan 1, 2002
3.261 bln
+1.1 bln
50.9%
jan 1, 2003
2.877 bln
-383.768 mln
-11.77%
jan 1, 2004
3.614 bln
+736.764 mln
25.61%
jan 1, 2005
4.221 bln
+606.919 mln
16.79%
jan 1, 2006
4.589 bln
+368.391 mln
8.73%
jan 1, 2007
5.451 bln
+862.144 mln
18.79%
jan 1, 2008
6.73 bln
+1.279 bln
23.46%
jan 1, 2009
6.894 bln
+163.815 mln
2.43%
jan 1, 2010
6.269 bln
-625.17 mln
-9.07%
jan 1, 2011
6.423 bln
+153.424 mln
2.45%
jan 1, 2012
7.256 bln
+833.769 mln
12.98%
jan 1, 2013
6.508 bln
-748.406 mln
-10.31%
jan 1, 2014
6.882 bln
+373.795 mln
5.74%
jan 1, 2015
8.094 bln
+1.212 bln
17.61%
jan 1, 2016
6.904 bln
-1.19 bln
-14.7%
Ranking of countries by current statistics by years


Comments: