29
/
en
AIzaSyAYiBZKx7MnpbEhh9jyipgxe19OcubqV5w
April 1, 2024
114063
Cote d'Ivoire
CIV
true
2
1
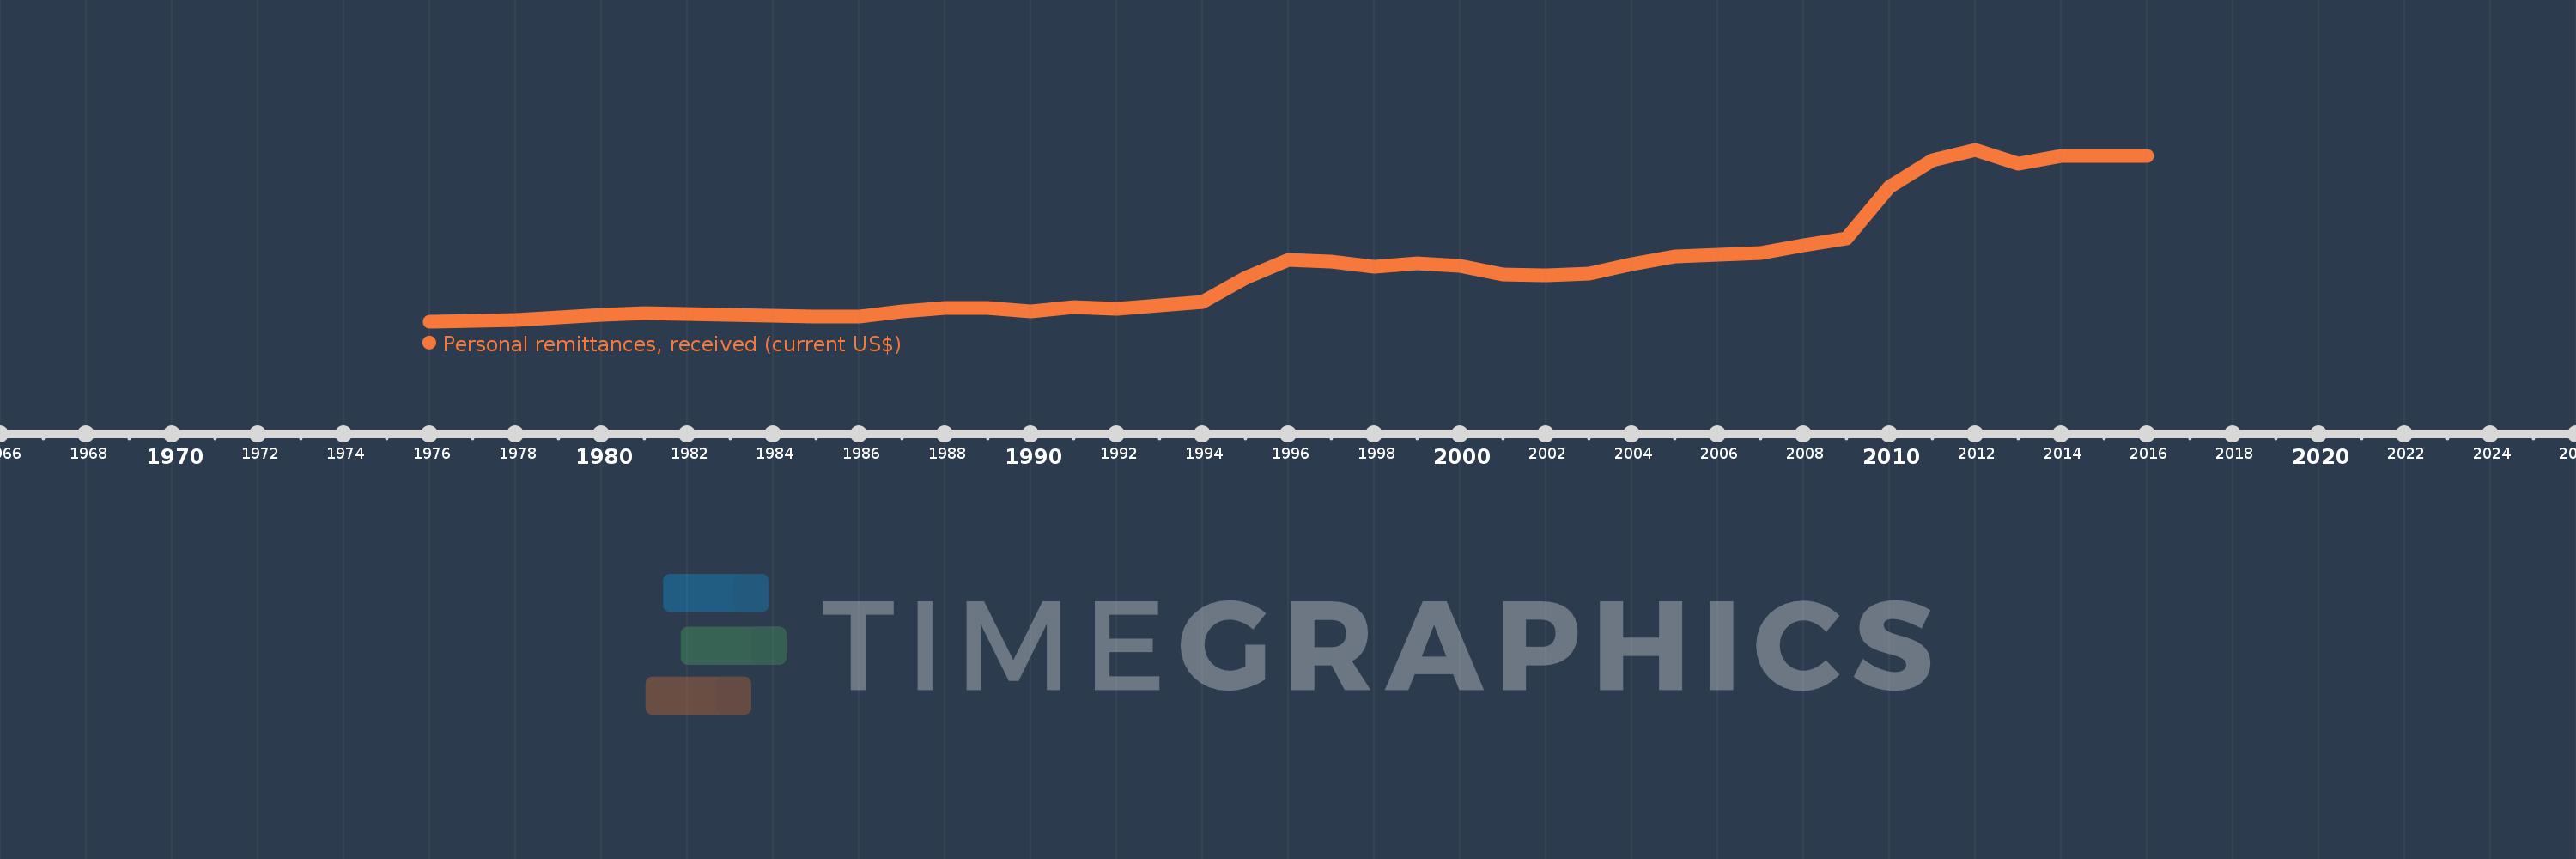
Personal remittances, received (current US$)
2016,2015,2014,2013,2012,2011,2010,2009,2008,2007,2006,2005,2004,2003,2002,2001,2000,1999,1998,1997,1996,1995,1994,1993,1992,1991,1990,1989,1988,1987,1986,1985,1984,1983,1982,1981,1980,1979,1978,1977,1976
This statistics in other country:
AfghanistanAlbaniaAlgeriaAngolaAntigua and BarbudaArab WorldArgentinaArmeniaArubaAustraliaAustriaAzerbaijanBangladeshBarbadosBelarusBelgiumBelizeBeninBermudaBhutanBoliviaBosnia and HerzegovinaBotswanaBrazilBulgariaBurkina FasoBurundiCabo VerdeCambodiaCameroonCanadaCaribbean small statesCentral African RepublicCentral Europe and the BalticsChadChileChinaColombiaComorosCongo, Dem. Rep.Congo, Rep.Costa RicaCote d'IvoireCroatiaCuracaoCyprusCzech RepublicDenmarkDjiboutiDominicaDominican RepublicEarly-demographic dividendEast Asia & PacificEast Asia & Pacific (excluding high income)East Asia & Pacific (IDA & IBRD countries)EcuadorEgypt, Arab Rep.El SalvadorEquatorial GuineaEritreaEstoniaEthiopiaEuro areaEurope & Central AsiaEurope & Central Asia (excluding high income)Europe & Central Asia (IDA & IBRD countries)European UnionFaroe IslandsFijiFinlandFragile and conflict affected situationsFranceFrench PolynesiaGabonGambia, TheGeorgiaGermanyGhanaGreeceGrenadaGuatemalaGuineaGuinea-BissauGuyanaHaitiHeavily indebted poor countries (HIPC)High incomeHondurasHong Kong SAR, ChinaHungaryIBRD onlyIcelandIDA & IBRD totalIDA blendIDA onlyIDA totalIndiaIndonesiaIran, Islamic Rep.IraqIrelandIsraelItalyJamaicaJapanJordanKazakhstanKenyaKiribatiKorea, Rep.KosovoKuwaitKyrgyz RepublicLao PDRLate-demographic dividendLatin America & Caribbean Latin America & Caribbean (excluding high income)Latin America & the Caribbean (IDA & IBRD countries)LatviaLeast developed countries: UN classificationLebanonLesothoLiberiaLibyaLithuaniaLow & middle incomeLow incomeLower middle incomeLuxembourgMacao SAR, ChinaMacedonia, FYRMadagascarMalawiMalaysiaMaldivesMaliMaltaMarshall IslandsMauritaniaMauritiusMexicoMicronesia, Fed. Sts.Middle East & North AfricaMiddle East & North Africa (excluding high income)Middle East & North Africa (IDA & IBRD countries)Middle incomeMoldovaMongoliaMontenegroMoroccoMozambiqueMyanmarNamibiaNepalNetherlandsNew CaledoniaNew ZealandNicaraguaNigerNigeriaNorth AmericaNorwayOECD membersOmanOther small statesPacific island small statesPakistanPalauPanamaPapua New GuineaParaguayPeruPhilippinesPolandPortugalPost-demographic dividendPre-demographic dividendQatarRomaniaRussian FederationRwandaSamoaSao Tome and PrincipeSaudi ArabiaSenegalSerbiaSeychellesSierra LeoneSint Maarten (Dutch part)Slovak RepublicSloveniaSmall statesSolomon IslandsSomaliaSouth AfricaSouth AsiaSouth Asia (IDA & IBRD)South SudanSpainSri LankaSt. Kitts and NevisSt. LuciaSt. Vincent and the GrenadinesSub-Saharan Africa Sub-Saharan Africa (excluding high income)Sub-Saharan Africa (IDA & IBRD countries)SudanSurinameSwazilandSwedenSwitzerlandSyrian Arab RepublicTajikistanTanzaniaThailandTimor-LesteTogoTongaTrinidad and TobagoTunisiaTurkeyTurkmenistanTuvaluUgandaUkraineUnited KingdomUnited StatesUpper middle incomeUruguayUzbekistanVanuatuVenezuela, RBVietnamWest Bank and GazaWorldYemen, Rep.ZambiaZimbabwe Timeline:
This timeline shows a graph from 1976 to 2016 of Cote d'Ivoire. No data until 1975. Number of actual observations by date: 41.
Source name:
World Development Indicators
Source organization:
World Bank staff estimates based on IMF balance of payments data.
Categories, topics:
Economy & Growth, Financial Sector, External Debt
Last updated:
apr 23, 2017
Indicators value changes by year
Minimum:
12.132 mln
jan 1, 1976
Maximum:
396.604 mln
jan 1, 2012
At the date of observation
Value
Absolute change
Change from previous value
jan 1, 1976
12.132 mln
+12.132 mln
0.0%
jan 1, 1977
14.229 mln
+2.097 mln
17.29%
jan 1, 1978
15.874 mln
+1.645 mln
11.56%
jan 1, 1979
22.158 mln
+6.283 mln
39.58%
jan 1, 1980
28.206 mln
+6.048 mln
27.3%
jan 1, 1981
32.185 mln
+3.979 mln
14.11%
jan 1, 1982
30.913 mln
-1.272 mln
-3.95%
jan 1, 1983
28.91 mln
-2.003 mln
-6.48%
jan 1, 1984
27.029 mln
-1.881 mln
-6.5%
jan 1, 1985
24.945 mln
-2.084 mln
-7.71%
jan 1, 1986
24.039 mln
-905.891K
-3.63%
jan 1, 1987
35.806 mln
+11.767 mln
48.95%
jan 1, 1988
42.923 mln
+7.117 mln
19.88%
jan 1, 1989
42.639 mln
-284.061K
-0.66%
jan 1, 1990
35.422 mln
-7.217 mln
-16.93%
jan 1, 1991
44.442 mln
+9.02 mln
25.46%
jan 1, 1992
41.474 mln
-2.968 mln
-6.68%
jan 1, 1993
49.519 mln
+8.045 mln
19.4%
jan 1, 1994
57.564 mln
+8.045 mln
16.25%
jan 1, 1995
110.41 mln
+52.846 mln
91.8%
jan 1, 1996
151.057 mln
+40.648 mln
36.82%
jan 1, 1997
147.004 mln
-4.054 mln
-2.68%
jan 1, 1998
136.379 mln
-10.625 mln
-7.23%
jan 1, 1999
142.568 mln
+6.189 mln
4.54%
jan 1, 2000
137.561 mln
-5.007 mln
-3.51%
jan 1, 2001
119.317 mln
-18.244 mln
-13.26%
jan 1, 2002
116.005 mln
-3.312 mln
-2.78%
jan 1, 2003
120.092 mln
+4.088 mln
3.52%
jan 1, 2004
141.604 mln
+21.511 mln
17.91%
jan 1, 2005
159.198 mln
+17.595 mln
12.43%
jan 1, 2006
163.174 mln
+3.976 mln
2.5%
jan 1, 2007
166.762 mln
+3.588 mln
2.2%
jan 1, 2008
184.693 mln
+17.931 mln
10.75%
jan 1, 2009
198.916 mln
+14.224 mln
7.7%
jan 1, 2010
315.078 mln
+116.162 mln
58.4%
jan 1, 2011
373.478 mln
+58.399 mln
18.53%
jan 1, 2012
396.604 mln
+23.126 mln
6.19%
jan 1, 2013
367.107 mln
-29.496 mln
-7.44%
jan 1, 2014
384.669 mln
+17.562 mln
4.78%
jan 1, 2015
384.669 mln
+0.042
0.0%
jan 1, 2016
384.669 mln
0.0
0.0%
Ranking of countries by current statistics by years


Comments: