29
/
en
AIzaSyAYiBZKx7MnpbEhh9jyipgxe19OcubqV5w
April 1, 2024
33765
European Union
EUU
false
2
1
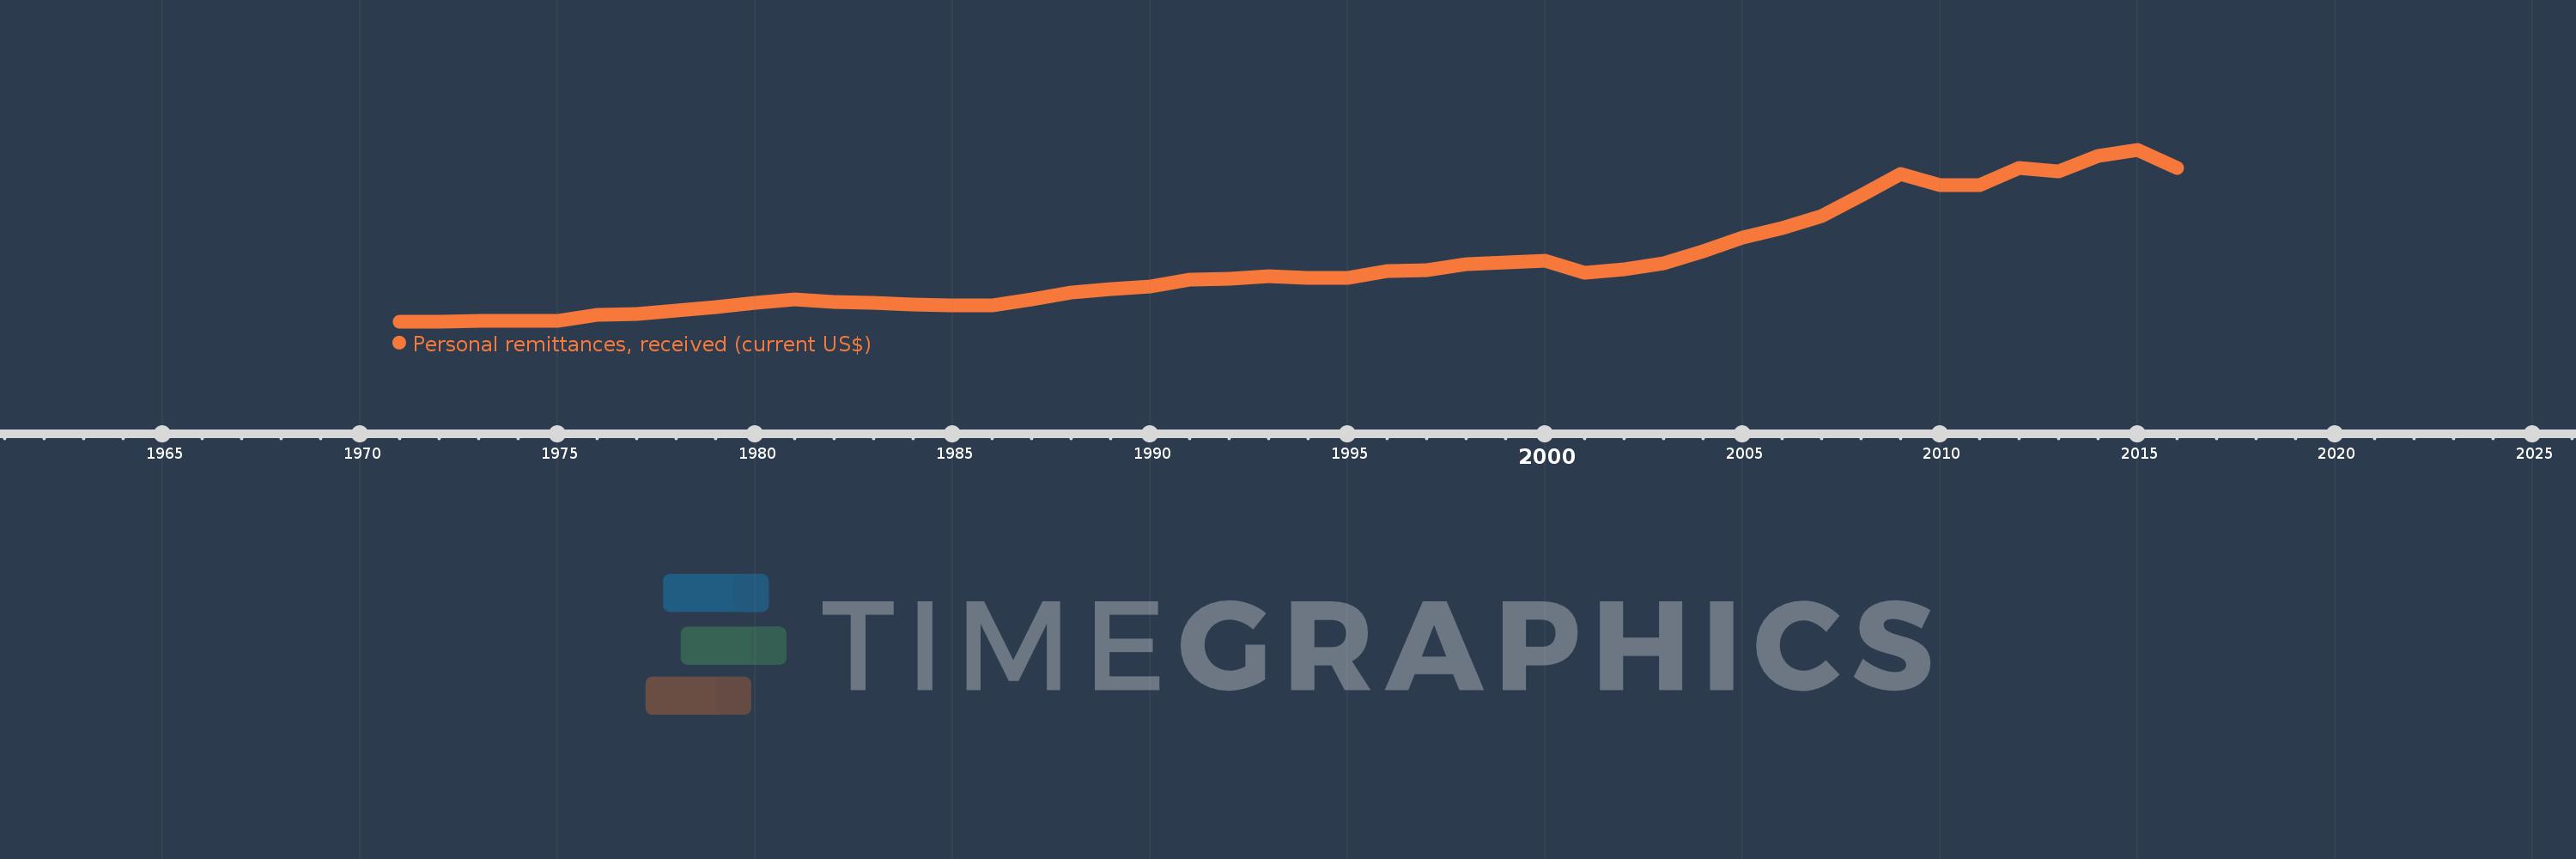
Personal remittances, received (current US$)
2016,2015,2014,2013,2012,2011,2010,2009,2008,2007,2006,2005,2004,2003,2002,2001,2000,1999,1998,1997,1996,1995,1994,1993,1992,1991,1990,1989,1988,1987,1986,1985,1984,1983,1982,1981,1980,1979,1978,1977,1976,1975,1974,1973,1972,1971
This statistics in other country:
AfghanistanAlbaniaAlgeriaAngolaAntigua and BarbudaArab WorldArgentinaArmeniaArubaAustraliaAustriaAzerbaijanBangladeshBarbadosBelarusBelgiumBelizeBeninBermudaBhutanBoliviaBosnia and HerzegovinaBotswanaBrazilBulgariaBurkina FasoBurundiCabo VerdeCambodiaCameroonCanadaCaribbean small statesCentral African RepublicCentral Europe and the BalticsChadChileChinaColombiaComorosCongo, Dem. Rep.Congo, Rep.Costa RicaCote d'IvoireCroatiaCuracaoCyprusCzech RepublicDenmarkDjiboutiDominicaDominican RepublicEarly-demographic dividendEast Asia & PacificEast Asia & Pacific (excluding high income)East Asia & Pacific (IDA & IBRD countries)EcuadorEgypt, Arab Rep.El SalvadorEquatorial GuineaEritreaEstoniaEthiopiaEuro areaEurope & Central AsiaEurope & Central Asia (excluding high income)Europe & Central Asia (IDA & IBRD countries)European UnionFaroe IslandsFijiFinlandFragile and conflict affected situationsFranceFrench PolynesiaGabonGambia, TheGeorgiaGermanyGhanaGreeceGrenadaGuatemalaGuineaGuinea-BissauGuyanaHaitiHeavily indebted poor countries (HIPC)High incomeHondurasHong Kong SAR, ChinaHungaryIBRD onlyIcelandIDA & IBRD totalIDA blendIDA onlyIDA totalIndiaIndonesiaIran, Islamic Rep.IraqIrelandIsraelItalyJamaicaJapanJordanKazakhstanKenyaKiribatiKorea, Rep.KosovoKuwaitKyrgyz RepublicLao PDRLate-demographic dividendLatin America & Caribbean Latin America & Caribbean (excluding high income)Latin America & the Caribbean (IDA & IBRD countries)LatviaLeast developed countries: UN classificationLebanonLesothoLiberiaLibyaLithuaniaLow & middle incomeLow incomeLower middle incomeLuxembourgMacao SAR, ChinaMacedonia, FYRMadagascarMalawiMalaysiaMaldivesMaliMaltaMarshall IslandsMauritaniaMauritiusMexicoMicronesia, Fed. Sts.Middle East & North AfricaMiddle East & North Africa (excluding high income)Middle East & North Africa (IDA & IBRD countries)Middle incomeMoldovaMongoliaMontenegroMoroccoMozambiqueMyanmarNamibiaNepalNetherlandsNew CaledoniaNew ZealandNicaraguaNigerNigeriaNorth AmericaNorwayOECD membersOmanOther small statesPacific island small statesPakistanPalauPanamaPapua New GuineaParaguayPeruPhilippinesPolandPortugalPost-demographic dividendPre-demographic dividendQatarRomaniaRussian FederationRwandaSamoaSao Tome and PrincipeSaudi ArabiaSenegalSerbiaSeychellesSierra LeoneSint Maarten (Dutch part)Slovak RepublicSloveniaSmall statesSolomon IslandsSomaliaSouth AfricaSouth AsiaSouth Asia (IDA & IBRD)South SudanSpainSri LankaSt. Kitts and NevisSt. LuciaSt. Vincent and the GrenadinesSub-Saharan Africa Sub-Saharan Africa (excluding high income)Sub-Saharan Africa (IDA & IBRD countries)SudanSurinameSwazilandSwedenSwitzerlandSyrian Arab RepublicTajikistanTanzaniaThailandTimor-LesteTogoTongaTrinidad and TobagoTunisiaTurkeyTurkmenistanTuvaluUgandaUkraineUnited KingdomUnited StatesUpper middle incomeUruguayUzbekistanVanuatuVenezuela, RBVietnamWest Bank and GazaWorldYemen, Rep.ZambiaZimbabwe Timeline:
This timeline shows a graph from 1971 to 2016 of European Union. No data until 1970. Number of actual observations by date: 46.
Source name:
World Development Indicators
Source organization:
World Bank staff estimates based on IMF balance of payments data.
Categories, topics:
Economy & Growth, Financial Sector, External Debt
Last updated:
apr 23, 2017
Indicators value changes by year
Minimum:
1.388 bln
jan 1, 1971
Maximum:
117.163 bln
jan 1, 2015
At the date of observation
Value
Absolute change
Change from previous value
jan 1, 1971
1.388 bln
+1.388 bln
0.0%
jan 1, 1972
1.835 bln
+446.912 mln
32.2%
jan 1, 1973
2.127 bln
+292.265 mln
15.93%
jan 1, 1974
2.231 bln
+103.61 mln
4.87%
jan 1, 1975
2.04 bln
-190.956 mln
-8.56%
jan 1, 1976
6.332 bln
+4.292 bln
210.43%
jan 1, 1977
6.837 bln
+505.265 mln
7.98%
jan 1, 1978
9.028 bln
+2.191 bln
32.05%
jan 1, 1979
11.497 bln
+2.469 bln
27.35%
jan 1, 1980
14.067 bln
+2.57 bln
22.35%
jan 1, 1981
16.399 bln
+2.332 bln
16.58%
jan 1, 1982
14.793 bln
-1.606 bln
-9.79%
jan 1, 1983
14.397 bln
-395.506 mln
-2.67%
jan 1, 1984
13.15 bln
-1.247 bln
-8.66%
jan 1, 1985
12.53 bln
-620.402 mln
-4.72%
jan 1, 1986
12.553 bln
+22.831 mln
0.18%
jan 1, 1987
16.479 bln
+3.926 bln
31.27%
jan 1, 1988
20.963 bln
+4.485 bln
27.22%
jan 1, 1989
23.786 bln
+2.822 bln
13.46%
jan 1, 1990
25.007 bln
+1.221 bln
5.13%
jan 1, 1991
30.131 bln
+5.124 bln
20.49%
jan 1, 1992
30.368 bln
+237.655 mln
0.79%
jan 1, 1993
32.422 bln
+2.053 bln
6.76%
jan 1, 1994
31.067 bln
-1.355 bln
-4.18%
jan 1, 1995
31.157 bln
+89.948 mln
0.29%
jan 1, 1996
35.727 bln
+4.571 bln
14.67%
jan 1, 1997
36.434 bln
+707.152 mln
1.98%
jan 1, 1998
40.293 bln
+3.858 bln
10.59%
jan 1, 1999
41.653 bln
+1.361 bln
3.38%
jan 1, 2000
42.846 bln
+1.193 bln
2.86%
jan 1, 2001
34.732 bln
-8.114 bln
-18.94%
jan 1, 2002
36.636 bln
+1.903 bln
5.48%
jan 1, 2003
40.75 bln
+4.114 bln
11.23%
jan 1, 2004
49.168 bln
+8.418 bln
20.66%
jan 1, 2005
58.577 bln
+9.409 bln
19.14%
jan 1, 2006
64.887 bln
+6.309 bln
10.77%
jan 1, 2007
72.645 bln
+7.759 bln
11.96%
jan 1, 2008
86.78 bln
+14.135 bln
19.46%
jan 1, 2009
100.846 bln
+14.066 bln
16.21%
jan 1, 2010
93.433 bln
-7.413 bln
-7.35%
jan 1, 2011
93.764 bln
+331.186 mln
0.35%
jan 1, 2012
105.174 bln
+11.41 bln
12.17%
jan 1, 2013
103.011 bln
-2.163 bln
-2.06%
jan 1, 2014
113.313 bln
+10.302 bln
10.0%
jan 1, 2015
117.163 bln
+3.85 bln
3.4%
jan 1, 2016
105.366 bln
-11.797 bln
-10.07%
Ranking of countries by current statistics by years


Comments: