29
/
en
AIzaSyAYiBZKx7MnpbEhh9jyipgxe19OcubqV5w
April 1, 2024
165317
Jordan
JOR
true
2
1
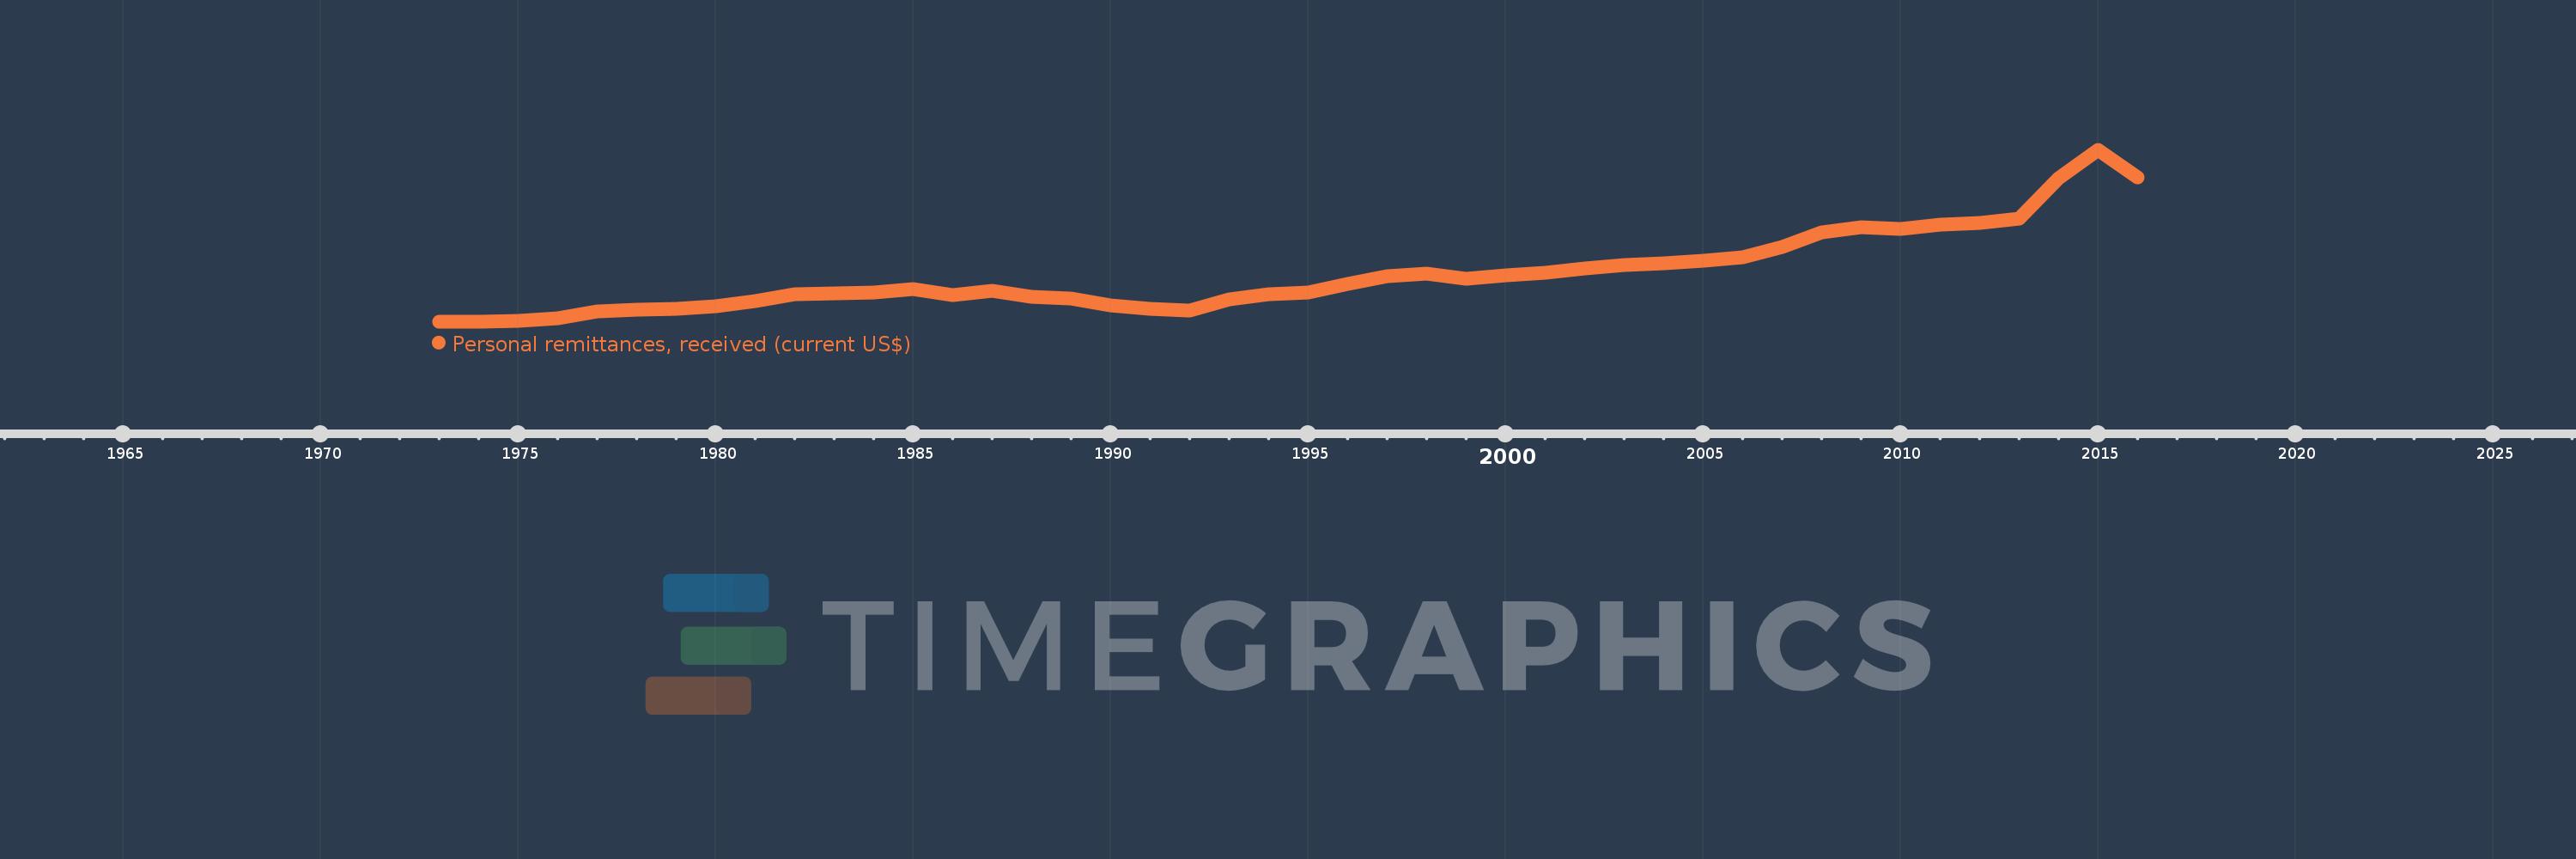
Personal remittances, received (current US$)
2016,2015,2014,2013,2012,2011,2010,2009,2008,2007,2006,2005,2004,2003,2002,2001,2000,1999,1998,1997,1996,1995,1994,1993,1992,1991,1990,1989,1988,1987,1986,1985,1984,1983,1982,1981,1980,1979,1978,1977,1976,1975,1974,1973
This statistics in other country:
AfghanistanAlbaniaAlgeriaAngolaAntigua and BarbudaArab WorldArgentinaArmeniaArubaAustraliaAustriaAzerbaijanBangladeshBarbadosBelarusBelgiumBelizeBeninBermudaBhutanBoliviaBosnia and HerzegovinaBotswanaBrazilBulgariaBurkina FasoBurundiCabo VerdeCambodiaCameroonCanadaCaribbean small statesCentral African RepublicCentral Europe and the BalticsChadChileChinaColombiaComorosCongo, Dem. Rep.Congo, Rep.Costa RicaCote d'IvoireCroatiaCuracaoCyprusCzech RepublicDenmarkDjiboutiDominicaDominican RepublicEarly-demographic dividendEast Asia & PacificEast Asia & Pacific (excluding high income)East Asia & Pacific (IDA & IBRD countries)EcuadorEgypt, Arab Rep.El SalvadorEquatorial GuineaEritreaEstoniaEthiopiaEuro areaEurope & Central AsiaEurope & Central Asia (excluding high income)Europe & Central Asia (IDA & IBRD countries)European UnionFaroe IslandsFijiFinlandFragile and conflict affected situationsFranceFrench PolynesiaGabonGambia, TheGeorgiaGermanyGhanaGreeceGrenadaGuatemalaGuineaGuinea-BissauGuyanaHaitiHeavily indebted poor countries (HIPC)High incomeHondurasHong Kong SAR, ChinaHungaryIBRD onlyIcelandIDA & IBRD totalIDA blendIDA onlyIDA totalIndiaIndonesiaIran, Islamic Rep.IraqIrelandIsraelItalyJamaicaJapanJordanKazakhstanKenyaKiribatiKorea, Rep.KosovoKuwaitKyrgyz RepublicLao PDRLate-demographic dividendLatin America & Caribbean Latin America & Caribbean (excluding high income)Latin America & the Caribbean (IDA & IBRD countries)LatviaLeast developed countries: UN classificationLebanonLesothoLiberiaLibyaLithuaniaLow & middle incomeLow incomeLower middle incomeLuxembourgMacao SAR, ChinaMacedonia, FYRMadagascarMalawiMalaysiaMaldivesMaliMaltaMarshall IslandsMauritaniaMauritiusMexicoMicronesia, Fed. Sts.Middle East & North AfricaMiddle East & North Africa (excluding high income)Middle East & North Africa (IDA & IBRD countries)Middle incomeMoldovaMongoliaMontenegroMoroccoMozambiqueMyanmarNamibiaNepalNetherlandsNew CaledoniaNew ZealandNicaraguaNigerNigeriaNorth AmericaNorwayOECD membersOmanOther small statesPacific island small statesPakistanPalauPanamaPapua New GuineaParaguayPeruPhilippinesPolandPortugalPost-demographic dividendPre-demographic dividendQatarRomaniaRussian FederationRwandaSamoaSao Tome and PrincipeSaudi ArabiaSenegalSerbiaSeychellesSierra LeoneSint Maarten (Dutch part)Slovak RepublicSloveniaSmall statesSolomon IslandsSomaliaSouth AfricaSouth AsiaSouth Asia (IDA & IBRD)South SudanSpainSri LankaSt. Kitts and NevisSt. LuciaSt. Vincent and the GrenadinesSub-Saharan Africa Sub-Saharan Africa (excluding high income)Sub-Saharan Africa (IDA & IBRD countries)SudanSurinameSwazilandSwedenSwitzerlandSyrian Arab RepublicTajikistanTanzaniaThailandTimor-LesteTogoTongaTrinidad and TobagoTunisiaTurkeyTurkmenistanTuvaluUgandaUkraineUnited KingdomUnited StatesUpper middle incomeUruguayUzbekistanVanuatuVenezuela, RBVietnamWest Bank and GazaWorldYemen, Rep.ZambiaZimbabwe Timeline:
This timeline shows a graph from 1973 to 2016 of Jordan. No data until 1972. Number of actual observations by date: 44.
Source name:
World Development Indicators
Source organization:
World Bank staff estimates based on IMF balance of payments data.
Categories, topics:
Economy & Growth, Financial Sector, External Debt
Last updated:
apr 23, 2017
Indicators value changes by year
Minimum:
20.72 mln
jan 1, 1973
Maximum:
6.37 bln
jan 1, 2015
At the date of observation
Value
Absolute change
Change from previous value
jan 1, 1973
20.72 mln
+20.72 mln
0.0%
jan 1, 1974
44.739 mln
+24.019 mln
115.92%
jan 1, 1975
74.823 mln
+30.084 mln
67.24%
jan 1, 1976
166.671 mln
+91.848 mln
122.75%
jan 1, 1977
410.864 mln
+244.193 mln
146.51%
jan 1, 1978
469.706 mln
+58.842 mln
14.32%
jan 1, 1979
520.576 mln
+50.871 mln
10.83%
jan 1, 1980
600.949 mln
+80.373 mln
15.44%
jan 1, 1981
793.86 mln
+192.911 mln
32.1%
jan 1, 1982
1.033 bln
+239.081 mln
30.12%
jan 1, 1983
1.082 bln
+49.344 mln
4.78%
jan 1, 1984
1.11 bln
+27.321 mln
2.52%
jan 1, 1985
1.237 bln
+127.073 mln
11.45%
jan 1, 1986
1.022 bln
-214.502 mln
-17.34%
jan 1, 1987
1.184 bln
+161.642 mln
15.81%
jan 1, 1988
937.952 mln
-245.867 mln
-20.77%
jan 1, 1989
894.98 mln
-42.972 mln
-4.58%
jan 1, 1990
627.071 mln
-267.91 mln
-29.93%
jan 1, 1991
499.267 mln
-127.804 mln
-20.38%
jan 1, 1992
447.906 mln
-51.361 mln
-10.29%
jan 1, 1993
843.66 mln
+395.754 mln
88.36%
jan 1, 1994
1.04 bln
+196.49 mln
23.29%
jan 1, 1995
1.094 bln
+53.753 mln
5.17%
jan 1, 1996
1.441 bln
+347.314 mln
31.75%
jan 1, 1997
1.702 bln
+260.616 mln
18.08%
jan 1, 1998
1.819 bln
+117.066 mln
6.88%
jan 1, 1999
1.624 bln
-195.063 mln
-10.72%
jan 1, 2000
1.752 bln
+127.786 mln
7.87%
jan 1, 2001
1.845 bln
+93.512 mln
5.34%
jan 1, 2002
2.011 bln
+166.2 mln
9.01%
jan 1, 2003
2.135 bln
+123.645 mln
6.15%
jan 1, 2004
2.201 bln
+66.149 mln
3.1%
jan 1, 2005
2.287 bln
+86.319 mln
3.92%
jan 1, 2006
2.421 bln
+133.427 mln
5.83%
jan 1, 2007
2.794 bln
+373.061 mln
15.41%
jan 1, 2008
3.326 bln
+532.441 mln
19.06%
jan 1, 2009
3.51 bln
+183.784 mln
5.53%
jan 1, 2010
3.465 bln
-44.949 mln
-1.28%
jan 1, 2011
3.623 bln
+157.746 mln
4.55%
jan 1, 2012
3.684 bln
+60.986 mln
1.68%
jan 1, 2013
3.848 bln
+164.366 mln
4.46%
jan 1, 2014
5.343 bln
+1.495 bln
38.84%
jan 1, 2015
6.37 bln
+1.027 bln
19.22%
jan 1, 2016
5.348 bln
-1.021 bln
-16.04%
Ranking of countries by current statistics by years


Comments: