29
/
en
AIzaSyAYiBZKx7MnpbEhh9jyipgxe19OcubqV5w
April 1, 2024
170369
Korea, Rep.
KOR
true
2
1
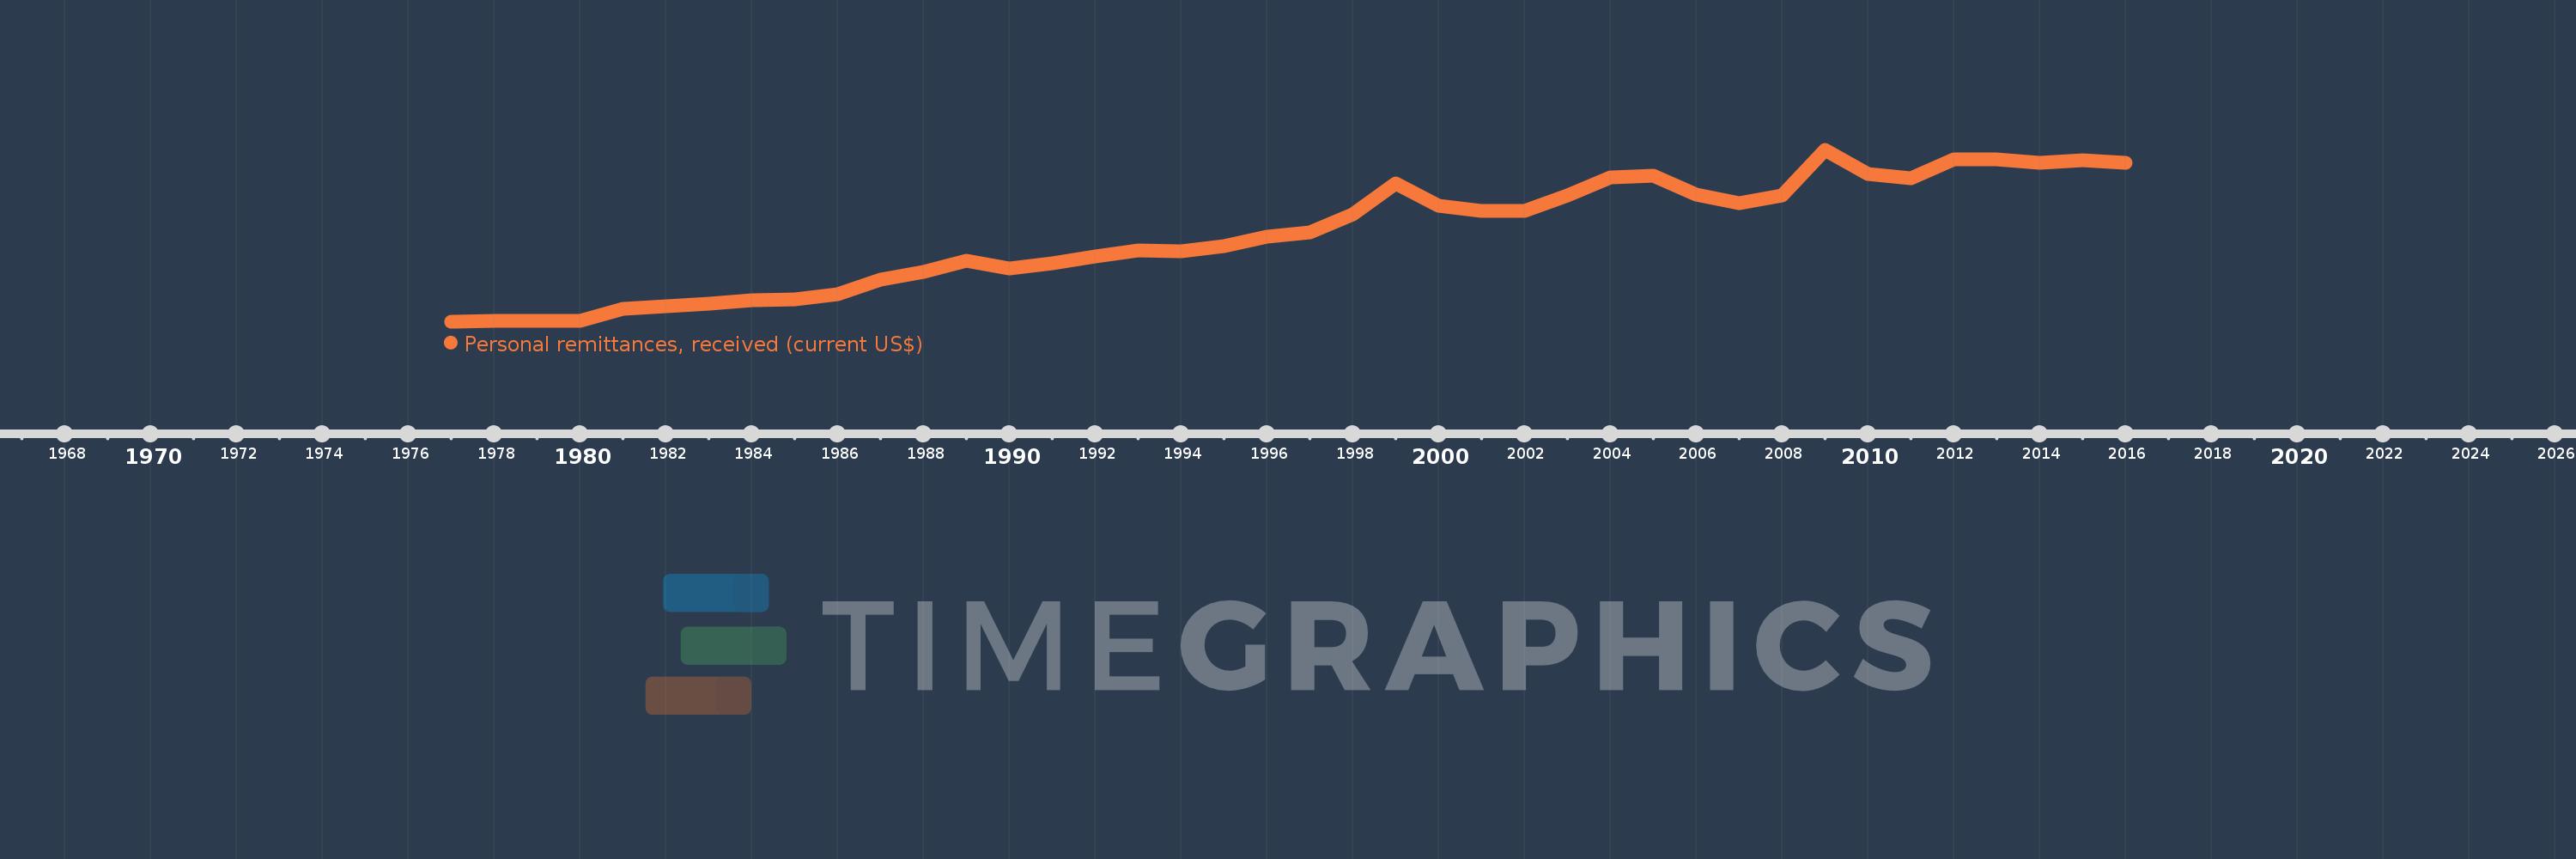
Personal remittances, received (current US$)
2016,2015,2014,2013,2012,2011,2010,2009,2008,2007,2006,2005,2004,2003,2002,2001,2000,1999,1998,1997,1996,1995,1994,1993,1992,1991,1990,1989,1988,1987,1986,1985,1984,1983,1982,1981,1980,1979,1978,1977
This statistics in other country:
AfghanistanAlbaniaAlgeriaAngolaAntigua and BarbudaArab WorldArgentinaArmeniaArubaAustraliaAustriaAzerbaijanBangladeshBarbadosBelarusBelgiumBelizeBeninBermudaBhutanBoliviaBosnia and HerzegovinaBotswanaBrazilBulgariaBurkina FasoBurundiCabo VerdeCambodiaCameroonCanadaCaribbean small statesCentral African RepublicCentral Europe and the BalticsChadChileChinaColombiaComorosCongo, Dem. Rep.Congo, Rep.Costa RicaCote d'IvoireCroatiaCuracaoCyprusCzech RepublicDenmarkDjiboutiDominicaDominican RepublicEarly-demographic dividendEast Asia & PacificEast Asia & Pacific (excluding high income)East Asia & Pacific (IDA & IBRD countries)EcuadorEgypt, Arab Rep.El SalvadorEquatorial GuineaEritreaEstoniaEthiopiaEuro areaEurope & Central AsiaEurope & Central Asia (excluding high income)Europe & Central Asia (IDA & IBRD countries)European UnionFaroe IslandsFijiFinlandFragile and conflict affected situationsFranceFrench PolynesiaGabonGambia, TheGeorgiaGermanyGhanaGreeceGrenadaGuatemalaGuineaGuinea-BissauGuyanaHaitiHeavily indebted poor countries (HIPC)High incomeHondurasHong Kong SAR, ChinaHungaryIBRD onlyIcelandIDA & IBRD totalIDA blendIDA onlyIDA totalIndiaIndonesiaIran, Islamic Rep.IraqIrelandIsraelItalyJamaicaJapanJordanKazakhstanKenyaKiribatiKorea, Rep.KosovoKuwaitKyrgyz RepublicLao PDRLate-demographic dividendLatin America & Caribbean Latin America & Caribbean (excluding high income)Latin America & the Caribbean (IDA & IBRD countries)LatviaLeast developed countries: UN classificationLebanonLesothoLiberiaLibyaLithuaniaLow & middle incomeLow incomeLower middle incomeLuxembourgMacao SAR, ChinaMacedonia, FYRMadagascarMalawiMalaysiaMaldivesMaliMaltaMarshall IslandsMauritaniaMauritiusMexicoMicronesia, Fed. Sts.Middle East & North AfricaMiddle East & North Africa (excluding high income)Middle East & North Africa (IDA & IBRD countries)Middle incomeMoldovaMongoliaMontenegroMoroccoMozambiqueMyanmarNamibiaNepalNetherlandsNew CaledoniaNew ZealandNicaraguaNigerNigeriaNorth AmericaNorwayOECD membersOmanOther small statesPacific island small statesPakistanPalauPanamaPapua New GuineaParaguayPeruPhilippinesPolandPortugalPost-demographic dividendPre-demographic dividendQatarRomaniaRussian FederationRwandaSamoaSao Tome and PrincipeSaudi ArabiaSenegalSerbiaSeychellesSierra LeoneSint Maarten (Dutch part)Slovak RepublicSloveniaSmall statesSolomon IslandsSomaliaSouth AfricaSouth AsiaSouth Asia (IDA & IBRD)South SudanSpainSri LankaSt. Kitts and NevisSt. LuciaSt. Vincent and the GrenadinesSub-Saharan Africa Sub-Saharan Africa (excluding high income)Sub-Saharan Africa (IDA & IBRD countries)SudanSurinameSwazilandSwedenSwitzerlandSyrian Arab RepublicTajikistanTanzaniaThailandTimor-LesteTogoTongaTrinidad and TobagoTunisiaTurkeyTurkmenistanTuvaluUgandaUkraineUnited KingdomUnited StatesUpper middle incomeUruguayUzbekistanVanuatuVenezuela, RBVietnamWest Bank and GazaWorldYemen, Rep.ZambiaZimbabwe Timeline:
This timeline shows a graph from 1977 to 2016 of Korea, Rep.. No data until 1976. Number of actual observations by date: 40.
Source name:
World Development Indicators
Source organization:
World Bank staff estimates based on IMF balance of payments data.
Categories, topics:
Economy & Growth, Financial Sector, External Debt
Last updated:
apr 23, 2017
Indicators value changes by year
Minimum:
47.0 mln
jan 1, 1977
Maximum:
6.952 bln
jan 1, 2009
At the date of observation
Value
Absolute change
Change from previous value
jan 1, 1977
47.0 mln
+47.0 mln
0.0%
jan 1, 1978
103.0 mln
+56.0 mln
119.15%
jan 1, 1979
105.0 mln
+2.0 mln
1.94%
jan 1, 1980
101.0 mln
-4.0 mln
-3.81%
jan 1, 1981
562.6 mln
+461.6 mln
457.03%
jan 1, 1982
690.6 mln
+128.0 mln
22.75%
jan 1, 1983
784.3 mln
+93.7 mln
13.57%
jan 1, 1984
920.5 mln
+136.2 mln
17.37%
jan 1, 1985
945.5 mln
+25.0 mln
2.72%
jan 1, 1986
1.158 bln
+212.3 mln
22.45%
jan 1, 1987
1.737 bln
+578.8 mln
49.99%
jan 1, 1988
2.071 bln
+334.0 mln
19.23%
jan 1, 1989
2.505 bln
+433.9 mln
20.96%
jan 1, 1990
2.187 bln
-317.4 mln
-12.67%
jan 1, 1991
2.413 bln
+225.9 mln
10.33%
jan 1, 1992
2.678 bln
+264.6 mln
10.97%
jan 1, 1993
2.927 bln
+249.1 mln
9.3%
jan 1, 1994
2.887 bln
-39.9 mln
-1.36%
jan 1, 1995
3.087 bln
+200.3 mln
6.94%
jan 1, 1996
3.49 bln
+403.4 mln
13.07%
jan 1, 1997
3.634 bln
+143.0 mln
4.1%
jan 1, 1998
4.364 bln
+730.6 mln
20.11%
jan 1, 1999
5.6 bln
+1.236 bln
28.32%
jan 1, 2000
4.705 bln
-894.6 mln
-15.98%
jan 1, 2001
4.506 bln
-198.7 mln
-4.22%
jan 1, 2002
4.501 bln
-5.2 mln
-0.12%
jan 1, 2003
5.121 bln
+619.6 mln
13.76%
jan 1, 2004
5.86 bln
+738.8 mln
14.43%
jan 1, 2005
5.917 bln
+56.8 mln
0.97%
jan 1, 2006
5.178 bln
-738.1 mln
-12.48%
jan 1, 2007
4.826 bln
-352.4 mln
-6.81%
jan 1, 2008
5.13 bln
+303.7 mln
6.29%
jan 1, 2009
6.952 bln
+1.823 bln
35.53%
jan 1, 2010
5.982 bln
-970.1 mln
-13.95%
jan 1, 2011
5.836 bln
-146.6 mln
-2.45%
jan 1, 2012
6.582 bln
+746.3 mln
12.79%
jan 1, 2013
6.571 bln
-11.0 mln
-0.17%
jan 1, 2014
6.455 bln
-115.6 mln
-1.76%
jan 1, 2015
6.551 bln
+95.1 mln
1.47%
jan 1, 2016
6.454 bln
-97.0 mln
-1.48%
Ranking of countries by current statistics by years


Comments: