29
/
en
AIzaSyAYiBZKx7MnpbEhh9jyipgxe19OcubqV5w
April 1, 2024
163041
Jamaica
JAM
true
2
1
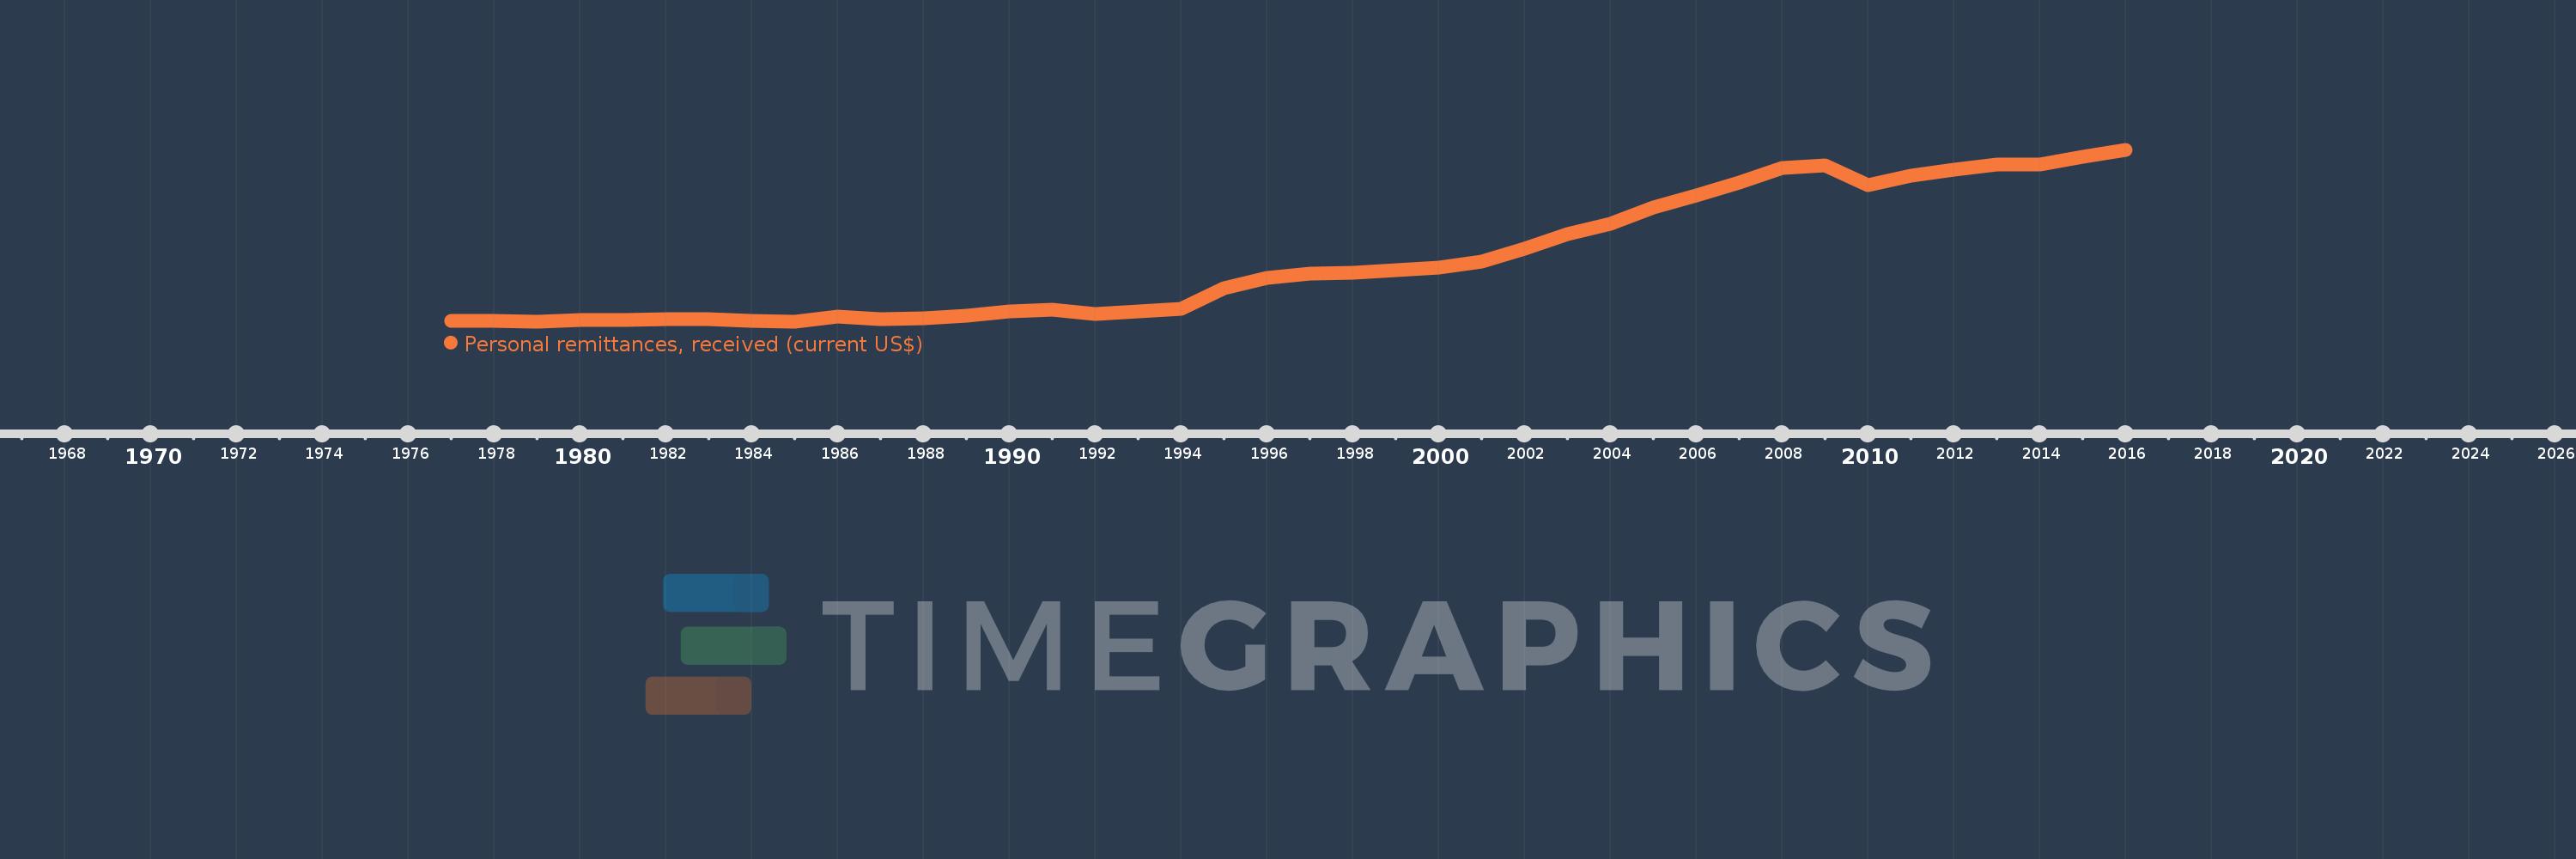
Personal remittances, received (current US$)
2016,2015,2014,2013,2012,2011,2010,2009,2008,2007,2006,2005,2004,2003,2002,2001,2000,1999,1998,1997,1996,1995,1994,1993,1992,1991,1990,1989,1988,1987,1986,1985,1984,1983,1982,1981,1980,1979,1978,1977
This statistics in other country:
AfghanistanAlbaniaAlgeriaAngolaAntigua and BarbudaArab WorldArgentinaArmeniaArubaAustraliaAustriaAzerbaijanBangladeshBarbadosBelarusBelgiumBelizeBeninBermudaBhutanBoliviaBosnia and HerzegovinaBotswanaBrazilBulgariaBurkina FasoBurundiCabo VerdeCambodiaCameroonCanadaCaribbean small statesCentral African RepublicCentral Europe and the BalticsChadChileChinaColombiaComorosCongo, Dem. Rep.Congo, Rep.Costa RicaCote d'IvoireCroatiaCuracaoCyprusCzech RepublicDenmarkDjiboutiDominicaDominican RepublicEarly-demographic dividendEast Asia & PacificEast Asia & Pacific (excluding high income)East Asia & Pacific (IDA & IBRD countries)EcuadorEgypt, Arab Rep.El SalvadorEquatorial GuineaEritreaEstoniaEthiopiaEuro areaEurope & Central AsiaEurope & Central Asia (excluding high income)Europe & Central Asia (IDA & IBRD countries)European UnionFaroe IslandsFijiFinlandFragile and conflict affected situationsFranceFrench PolynesiaGabonGambia, TheGeorgiaGermanyGhanaGreeceGrenadaGuatemalaGuineaGuinea-BissauGuyanaHaitiHeavily indebted poor countries (HIPC)High incomeHondurasHong Kong SAR, ChinaHungaryIBRD onlyIcelandIDA & IBRD totalIDA blendIDA onlyIDA totalIndiaIndonesiaIran, Islamic Rep.IraqIrelandIsraelItalyJamaicaJapanJordanKazakhstanKenyaKiribatiKorea, Rep.KosovoKuwaitKyrgyz RepublicLao PDRLate-demographic dividendLatin America & Caribbean Latin America & Caribbean (excluding high income)Latin America & the Caribbean (IDA & IBRD countries)LatviaLeast developed countries: UN classificationLebanonLesothoLiberiaLibyaLithuaniaLow & middle incomeLow incomeLower middle incomeLuxembourgMacao SAR, ChinaMacedonia, FYRMadagascarMalawiMalaysiaMaldivesMaliMaltaMarshall IslandsMauritaniaMauritiusMexicoMicronesia, Fed. Sts.Middle East & North AfricaMiddle East & North Africa (excluding high income)Middle East & North Africa (IDA & IBRD countries)Middle incomeMoldovaMongoliaMontenegroMoroccoMozambiqueMyanmarNamibiaNepalNetherlandsNew CaledoniaNew ZealandNicaraguaNigerNigeriaNorth AmericaNorwayOECD membersOmanOther small statesPacific island small statesPakistanPalauPanamaPapua New GuineaParaguayPeruPhilippinesPolandPortugalPost-demographic dividendPre-demographic dividendQatarRomaniaRussian FederationRwandaSamoaSao Tome and PrincipeSaudi ArabiaSenegalSerbiaSeychellesSierra LeoneSint Maarten (Dutch part)Slovak RepublicSloveniaSmall statesSolomon IslandsSomaliaSouth AfricaSouth AsiaSouth Asia (IDA & IBRD)South SudanSpainSri LankaSt. Kitts and NevisSt. LuciaSt. Vincent and the GrenadinesSub-Saharan Africa Sub-Saharan Africa (excluding high income)Sub-Saharan Africa (IDA & IBRD countries)SudanSurinameSwazilandSwedenSwitzerlandSyrian Arab RepublicTajikistanTanzaniaThailandTimor-LesteTogoTongaTrinidad and TobagoTunisiaTurkeyTurkmenistanTuvaluUgandaUkraineUnited KingdomUnited StatesUpper middle incomeUruguayUzbekistanVanuatuVenezuela, RBVietnamWest Bank and GazaWorldYemen, Rep.ZambiaZimbabwe Timeline:
This timeline shows a graph from 1977 to 2016 of Jamaica. No data until 1976. Number of actual observations by date: 40.
Source name:
World Development Indicators
Source organization:
World Bank staff estimates based on IMF balance of payments data.
Categories, topics:
Economy & Growth, Financial Sector, External Debt
Last updated:
apr 23, 2017
Indicators value changes by year
Minimum:
69.1 mln
jan 1, 1979
Maximum:
2.361 bln
jan 1, 2016
At the date of observation
Value
Absolute change
Change from previous value
jan 1, 1977
88.5 mln
+88.5 mln
0.0%
jan 1, 1978
81.7 mln
-6.8 mln
-7.68%
jan 1, 1979
69.1 mln
-12.6 mln
-15.42%
jan 1, 1980
89.9 mln
+20.8 mln
30.1%
jan 1, 1981
95.5 mln
+5.6 mln
6.23%
jan 1, 1982
107.0 mln
+11.5 mln
12.04%
jan 1, 1983
111.1 mln
+4.1 mln
3.83%
jan 1, 1984
84.2 mln
-26.9 mln
-24.21%
jan 1, 1985
73.9 mln
-10.3 mln
-12.23%
jan 1, 1986
145.5 mln
+71.6 mln
96.89%
jan 1, 1987
111.5 mln
-34.0 mln
-23.37%
jan 1, 1988
120.5 mln
+9.0 mln
8.07%
jan 1, 1989
153.9 mln
+33.4 mln
27.72%
jan 1, 1990
208.5 mln
+54.6 mln
35.48%
jan 1, 1991
228.7 mln
+20.2 mln
9.69%
jan 1, 1992
181.3 mln
-47.4 mln
-20.73%
jan 1, 1993
215.6 mln
+34.3 mln
18.92%
jan 1, 1994
239.2 mln
+23.6 mln
10.95%
jan 1, 1995
522.1 mln
+282.9 mln
118.27%
jan 1, 1996
653.1 mln
+131.0 mln
25.09%
jan 1, 1997
714.1 mln
+61.0 mln
9.34%
jan 1, 1998
729.8 mln
+15.7 mln
2.2%
jan 1, 1999
757.6 mln
+27.8 mln
3.81%
jan 1, 2000
790.0 mln
+32.4 mln
4.28%
jan 1, 2001
877.7 mln
+87.7 mln
11.1%
jan 1, 2002
1.047 bln
+168.9 mln
19.24%
jan 1, 2003
1.242 bln
+195.0 mln
18.63%
jan 1, 2004
1.38 bln
+138.0 mln
11.11%
jan 1, 2005
1.601 bln
+221.598 mln
16.06%
jan 1, 2006
1.762 bln
+160.431 mln
10.02%
jan 1, 2007
1.924 bln
+162.107 mln
9.2%
jan 1, 2008
2.122 bln
+198.356 mln
10.31%
jan 1, 2009
2.157 bln
+34.498 mln
1.63%
jan 1, 2010
1.889 bln
-267.095 mln
-12.39%
jan 1, 2011
2.026 bln
+136.951 mln
7.25%
jan 1, 2012
2.106 bln
+79.161 mln
3.91%
jan 1, 2013
2.168 bln
+62.53 mln
2.97%
jan 1, 2014
2.172 bln
+3.751 mln
0.17%
jan 1, 2015
2.269 bln
+96.897 mln
4.46%
jan 1, 2016
2.361 bln
+92.449 mln
4.07%
Ranking of countries by current statistics by years


Comments: