29
/
en
AIzaSyAYiBZKx7MnpbEhh9jyipgxe19OcubqV5w
April 1, 2024
188268
Malaysia
MYS
true
2
1
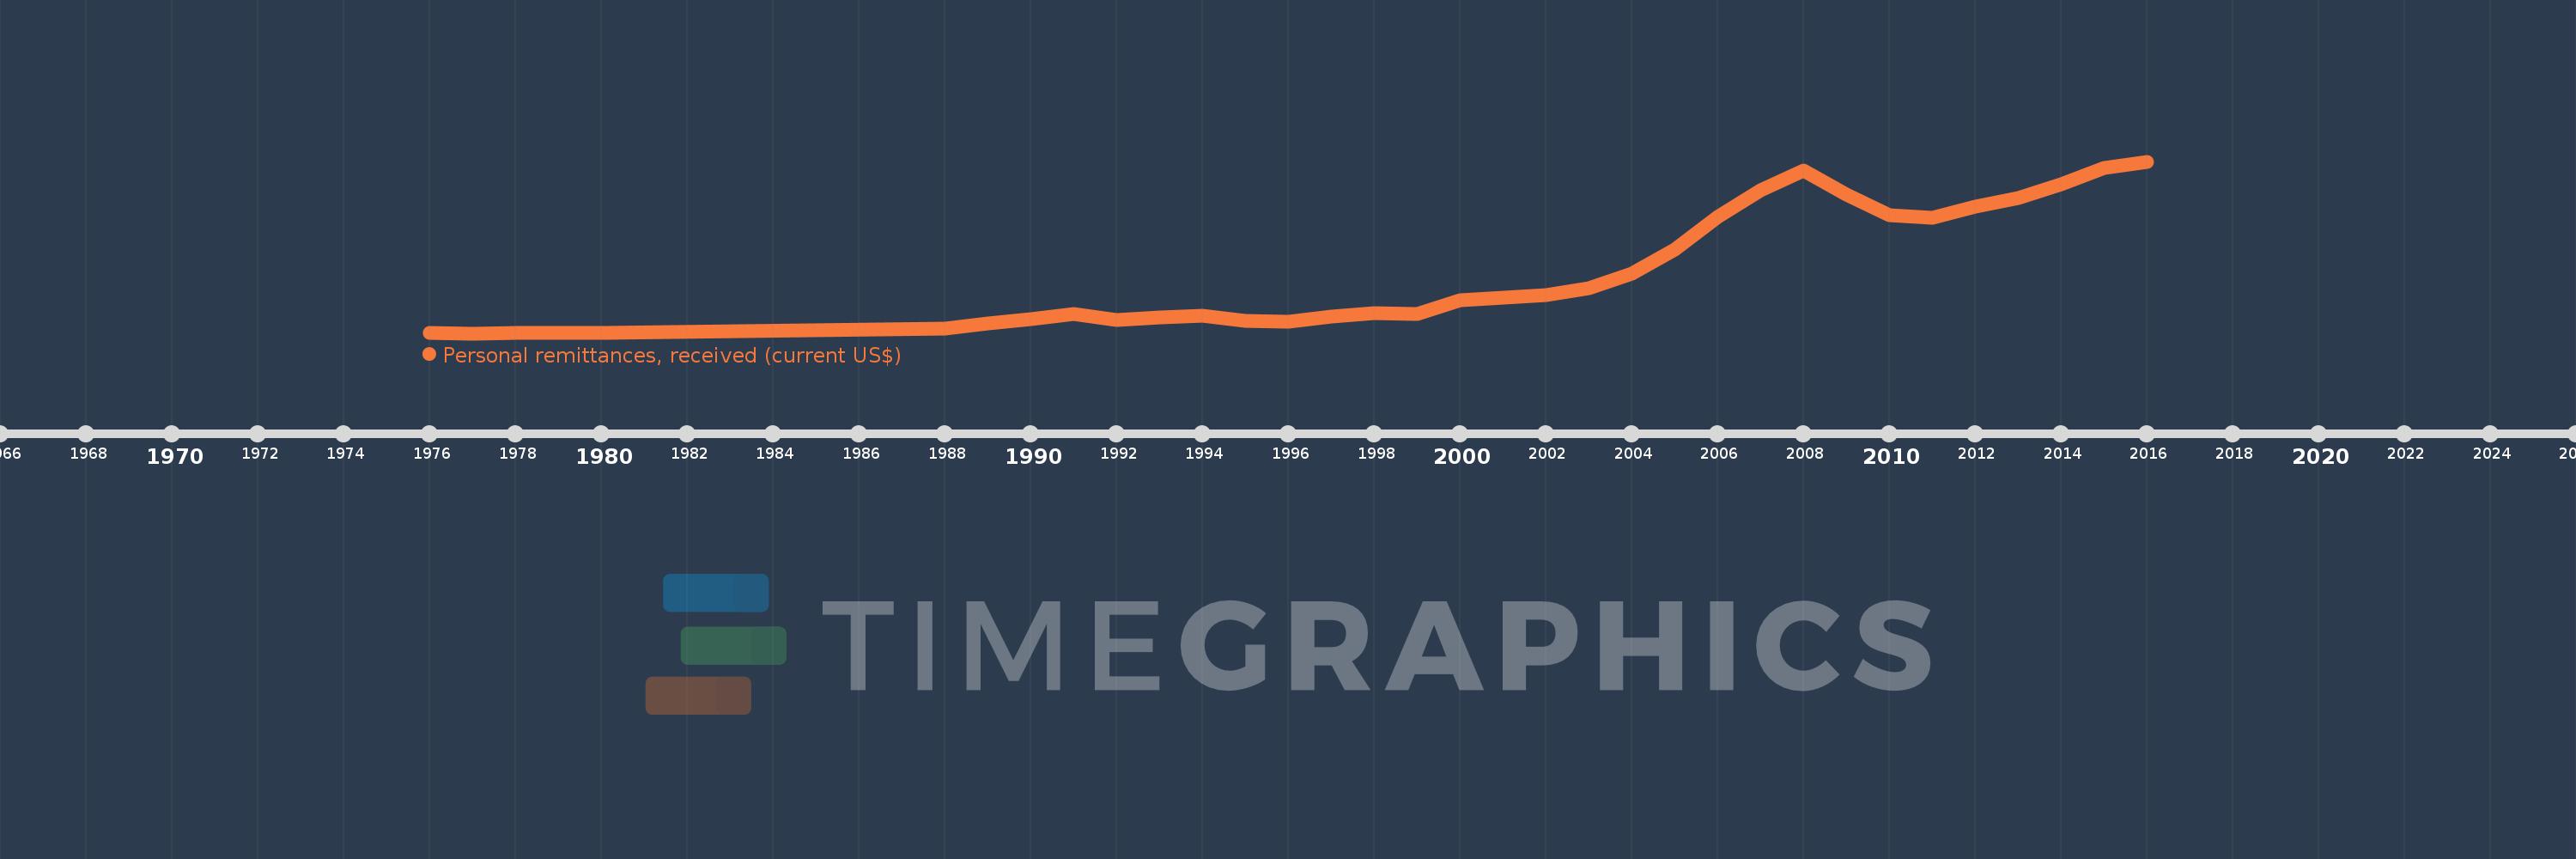
Personal remittances, received (current US$)
2016,2015,2014,2013,2012,2011,2010,2009,2008,2007,2006,2005,2004,2003,2002,2001,2000,1999,1998,1997,1996,1995,1994,1993,1992,1991,1990,1989,1988,1980,1979,1978,1977,1976
This statistics in other country:
AfghanistanAlbaniaAlgeriaAngolaAntigua and BarbudaArab WorldArgentinaArmeniaArubaAustraliaAustriaAzerbaijanBangladeshBarbadosBelarusBelgiumBelizeBeninBermudaBhutanBoliviaBosnia and HerzegovinaBotswanaBrazilBulgariaBurkina FasoBurundiCabo VerdeCambodiaCameroonCanadaCaribbean small statesCentral African RepublicCentral Europe and the BalticsChadChileChinaColombiaComorosCongo, Dem. Rep.Congo, Rep.Costa RicaCote d'IvoireCroatiaCuracaoCyprusCzech RepublicDenmarkDjiboutiDominicaDominican RepublicEarly-demographic dividendEast Asia & PacificEast Asia & Pacific (excluding high income)East Asia & Pacific (IDA & IBRD countries)EcuadorEgypt, Arab Rep.El SalvadorEquatorial GuineaEritreaEstoniaEthiopiaEuro areaEurope & Central AsiaEurope & Central Asia (excluding high income)Europe & Central Asia (IDA & IBRD countries)European UnionFaroe IslandsFijiFinlandFragile and conflict affected situationsFranceFrench PolynesiaGabonGambia, TheGeorgiaGermanyGhanaGreeceGrenadaGuatemalaGuineaGuinea-BissauGuyanaHaitiHeavily indebted poor countries (HIPC)High incomeHondurasHong Kong SAR, ChinaHungaryIBRD onlyIcelandIDA & IBRD totalIDA blendIDA onlyIDA totalIndiaIndonesiaIran, Islamic Rep.IraqIrelandIsraelItalyJamaicaJapanJordanKazakhstanKenyaKiribatiKorea, Rep.KosovoKuwaitKyrgyz RepublicLao PDRLate-demographic dividendLatin America & Caribbean Latin America & Caribbean (excluding high income)Latin America & the Caribbean (IDA & IBRD countries)LatviaLeast developed countries: UN classificationLebanonLesothoLiberiaLibyaLithuaniaLow & middle incomeLow incomeLower middle incomeLuxembourgMacao SAR, ChinaMacedonia, FYRMadagascarMalawiMalaysiaMaldivesMaliMaltaMarshall IslandsMauritaniaMauritiusMexicoMicronesia, Fed. Sts.Middle East & North AfricaMiddle East & North Africa (excluding high income)Middle East & North Africa (IDA & IBRD countries)Middle incomeMoldovaMongoliaMontenegroMoroccoMozambiqueMyanmarNamibiaNepalNetherlandsNew CaledoniaNew ZealandNicaraguaNigerNigeriaNorth AmericaNorwayOECD membersOmanOther small statesPacific island small statesPakistanPalauPanamaPapua New GuineaParaguayPeruPhilippinesPolandPortugalPost-demographic dividendPre-demographic dividendQatarRomaniaRussian FederationRwandaSamoaSao Tome and PrincipeSaudi ArabiaSenegalSerbiaSeychellesSierra LeoneSint Maarten (Dutch part)Slovak RepublicSloveniaSmall statesSolomon IslandsSomaliaSouth AfricaSouth AsiaSouth Asia (IDA & IBRD)South SudanSpainSri LankaSt. Kitts and NevisSt. LuciaSt. Vincent and the GrenadinesSub-Saharan Africa Sub-Saharan Africa (excluding high income)Sub-Saharan Africa (IDA & IBRD countries)SudanSurinameSwazilandSwedenSwitzerlandSyrian Arab RepublicTajikistanTanzaniaThailandTimor-LesteTogoTongaTrinidad and TobagoTunisiaTurkeyTurkmenistanTuvaluUgandaUkraineUnited KingdomUnited StatesUpper middle incomeUruguayUzbekistanVanuatuVenezuela, RBVietnamWest Bank and GazaWorldYemen, Rep.ZambiaZimbabwe Timeline:
This timeline shows a graph from 1976 to 2016 of Malaysia. No data until 1975. Number of actual observations by date: 34.
Source name:
World Development Indicators
Source organization:
World Bank staff estimates based on IMF balance of payments data.
Categories, topics:
Economy & Growth, Financial Sector, External Debt
Last updated:
apr 23, 2017
Indicators value changes by year
Minimum:
3.935 mln
jan 1, 1977
Maximum:
1.643 bln
jan 1, 2016
At the date of observation
Value
Absolute change
Change from previous value
jan 1, 1976
4.177 mln
+4.177 mln
0.0%
jan 1, 1977
3.935 mln
-242.919K
-5.81%
jan 1, 1978
4.063 mln
+128.353K
3.26%
jan 1, 1979
4.318 mln
+254.791K
6.27%
jan 1, 1980
4.569 mln
+251.75K
5.83%
jan 1, 1988
48.817 mln
+44.247 mln
968.32%
jan 1, 1989
99.665 mln
+50.848 mln
104.16%
jan 1, 1990
138.805 mln
+39.14 mln
39.27%
jan 1, 1991
185.221 mln
+46.416 mln
33.44%
jan 1, 1992
130.179 mln
-55.042 mln
-29.72%
jan 1, 1993
153.098 mln
+22.92 mln
17.61%
jan 1, 1994
175.596 mln
+22.497 mln
14.69%
jan 1, 1995
119.272 mln
-56.324 mln
-32.08%
jan 1, 1996
115.796 mln
-3.476 mln
-2.91%
jan 1, 1997
164.153 mln
+48.357 mln
41.76%
jan 1, 1998
194.441 mln
+30.288 mln
18.45%
jan 1, 1999
189.584 mln
-4.857 mln
-2.5%
jan 1, 2000
322.895 mln
+133.31 mln
70.32%
jan 1, 2001
342.368 mln
+19.474 mln
6.03%
jan 1, 2002
367.105 mln
+24.737 mln
7.23%
jan 1, 2003
435.0 mln
+67.895 mln
18.49%
jan 1, 2004
571.053 mln
+136.053 mln
31.28%
jan 1, 2005
801.868 mln
+230.816 mln
40.42%
jan 1, 2006
1.117 bln
+315.104 mln
39.3%
jan 1, 2007
1.365 bln
+248.504 mln
22.25%
jan 1, 2008
1.556 bln
+190.76 mln
13.97%
jan 1, 2009
1.329 bln
-227.165 mln
-14.6%
jan 1, 2010
1.131 bln
-198.198 mln
-14.91%
jan 1, 2011
1.103 bln
-27.947 mln
-2.47%
jan 1, 2012
1.211 bln
+108.571 mln
9.84%
jan 1, 2013
1.294 bln
+82.31 mln
6.79%
jan 1, 2014
1.423 bln
+129.565 mln
10.01%
jan 1, 2015
1.58 bln
+156.147 mln
10.97%
jan 1, 2016
1.643 bln
+62.993 mln
3.99%
Ranking of countries by current statistics by years


Comments: