29
/
en
AIzaSyAYiBZKx7MnpbEhh9jyipgxe19OcubqV5w
April 1, 2024
190708
Mali
MLI
true
2
1
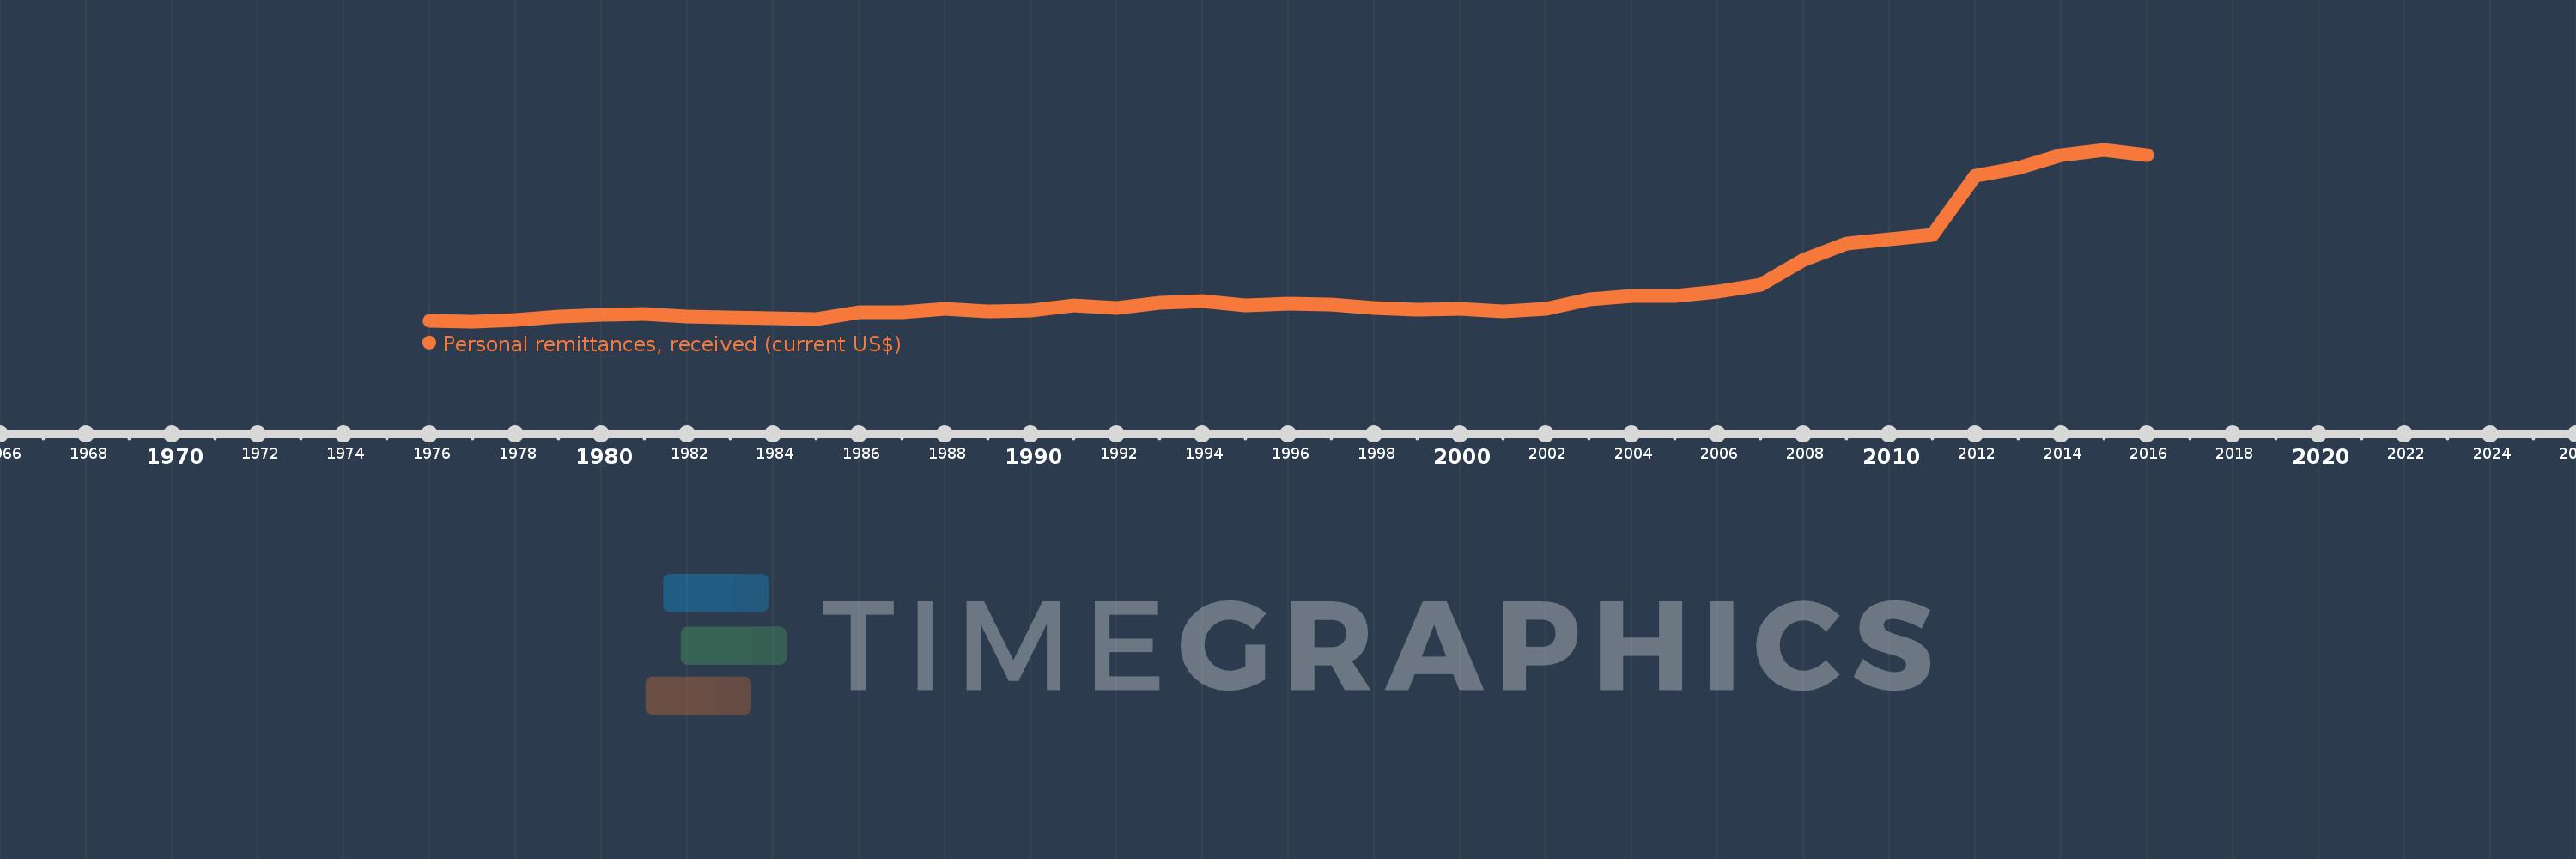
Personal remittances, received (current US$)
2016,2015,2014,2013,2012,2011,2010,2009,2008,2007,2006,2005,2004,2003,2002,2001,2000,1999,1998,1997,1996,1995,1994,1993,1992,1991,1990,1989,1988,1987,1986,1985,1984,1983,1982,1981,1980,1979,1978,1977,1976
This statistics in other country:
AfghanistanAlbaniaAlgeriaAngolaAntigua and BarbudaArab WorldArgentinaArmeniaArubaAustraliaAustriaAzerbaijanBangladeshBarbadosBelarusBelgiumBelizeBeninBermudaBhutanBoliviaBosnia and HerzegovinaBotswanaBrazilBulgariaBurkina FasoBurundiCabo VerdeCambodiaCameroonCanadaCaribbean small statesCentral African RepublicCentral Europe and the BalticsChadChileChinaColombiaComorosCongo, Dem. Rep.Congo, Rep.Costa RicaCote d'IvoireCroatiaCuracaoCyprusCzech RepublicDenmarkDjiboutiDominicaDominican RepublicEarly-demographic dividendEast Asia & PacificEast Asia & Pacific (excluding high income)East Asia & Pacific (IDA & IBRD countries)EcuadorEgypt, Arab Rep.El SalvadorEquatorial GuineaEritreaEstoniaEthiopiaEuro areaEurope & Central AsiaEurope & Central Asia (excluding high income)Europe & Central Asia (IDA & IBRD countries)European UnionFaroe IslandsFijiFinlandFragile and conflict affected situationsFranceFrench PolynesiaGabonGambia, TheGeorgiaGermanyGhanaGreeceGrenadaGuatemalaGuineaGuinea-BissauGuyanaHaitiHeavily indebted poor countries (HIPC)High incomeHondurasHong Kong SAR, ChinaHungaryIBRD onlyIcelandIDA & IBRD totalIDA blendIDA onlyIDA totalIndiaIndonesiaIran, Islamic Rep.IraqIrelandIsraelItalyJamaicaJapanJordanKazakhstanKenyaKiribatiKorea, Rep.KosovoKuwaitKyrgyz RepublicLao PDRLate-demographic dividendLatin America & Caribbean Latin America & Caribbean (excluding high income)Latin America & the Caribbean (IDA & IBRD countries)LatviaLeast developed countries: UN classificationLebanonLesothoLiberiaLibyaLithuaniaLow & middle incomeLow incomeLower middle incomeLuxembourgMacao SAR, ChinaMacedonia, FYRMadagascarMalawiMalaysiaMaldivesMaliMaltaMarshall IslandsMauritaniaMauritiusMexicoMicronesia, Fed. Sts.Middle East & North AfricaMiddle East & North Africa (excluding high income)Middle East & North Africa (IDA & IBRD countries)Middle incomeMoldovaMongoliaMontenegroMoroccoMozambiqueMyanmarNamibiaNepalNetherlandsNew CaledoniaNew ZealandNicaraguaNigerNigeriaNorth AmericaNorwayOECD membersOmanOther small statesPacific island small statesPakistanPalauPanamaPapua New GuineaParaguayPeruPhilippinesPolandPortugalPost-demographic dividendPre-demographic dividendQatarRomaniaRussian FederationRwandaSamoaSao Tome and PrincipeSaudi ArabiaSenegalSerbiaSeychellesSierra LeoneSint Maarten (Dutch part)Slovak RepublicSloveniaSmall statesSolomon IslandsSomaliaSouth AfricaSouth AsiaSouth Asia (IDA & IBRD)South SudanSpainSri LankaSt. Kitts and NevisSt. LuciaSt. Vincent and the GrenadinesSub-Saharan Africa Sub-Saharan Africa (excluding high income)Sub-Saharan Africa (IDA & IBRD countries)SudanSurinameSwazilandSwedenSwitzerlandSyrian Arab RepublicTajikistanTanzaniaThailandTimor-LesteTogoTongaTrinidad and TobagoTunisiaTurkeyTurkmenistanTuvaluUgandaUkraineUnited KingdomUnited StatesUpper middle incomeUruguayUzbekistanVanuatuVenezuela, RBVietnamWest Bank and GazaWorldYemen, Rep.ZambiaZimbabwe Timeline:
This timeline shows a graph from 1976 to 2016 of Mali. No data until 1975. Number of actual observations by date: 41.
Source name:
World Development Indicators
Source organization:
World Bank staff estimates based on IMF balance of payments data.
Categories, topics:
Economy & Growth, Financial Sector, External Debt
Last updated:
apr 23, 2017
Indicators value changes by year
Minimum:
17.744 mln
jan 1, 1977
Maximum:
920.265 mln
jan 1, 2015
At the date of observation
Value
Absolute change
Change from previous value
jan 1, 1976
23.307 mln
+23.307 mln
0.0%
jan 1, 1977
17.744 mln
-5.563 mln
-23.87%
jan 1, 1978
26.498 mln
+8.754 mln
49.33%
jan 1, 1979
44.315 mln
+17.817 mln
67.24%
jan 1, 1980
54.061 mln
+9.746 mln
21.99%
jan 1, 1981
59.4 mln
+5.339 mln
9.88%
jan 1, 1982
47.657 mln
-11.743 mln
-19.77%
jan 1, 1983
39.409 mln
-8.248 mln
-17.31%
jan 1, 1984
36.477 mln
-2.932 mln
-7.44%
jan 1, 1985
32.498 mln
-3.979 mln
-10.91%
jan 1, 1986
66.999 mln
+34.501 mln
106.17%
jan 1, 1987
68.437 mln
+1.438 mln
2.15%
jan 1, 1988
88.176 mln
+19.739 mln
28.84%
jan 1, 1989
73.225 mln
-14.95 mln
-16.96%
jan 1, 1990
75.954 mln
+2.729 mln
3.73%
jan 1, 1991
106.918 mln
+30.964 mln
40.77%
jan 1, 1992
93.014 mln
-13.904 mln
-13.0%
jan 1, 1993
116.551 mln
+23.536 mln
25.3%
jan 1, 1994
125.617 mln
+9.066 mln
7.78%
jan 1, 1995
103.187 mln
-22.43 mln
-17.86%
jan 1, 1996
112.111 mln
+8.924 mln
8.65%
jan 1, 1997
110.72 mln
-1.391 mln
-1.24%
jan 1, 1998
91.725 mln
-18.995 mln
-17.16%
jan 1, 1999
84.463 mln
-7.262 mln
-7.92%
jan 1, 2000
86.308 mln
+1.846 mln
2.19%
jan 1, 2001
73.164 mln
-13.144 mln
-15.23%
jan 1, 2002
88.167 mln
+15.003 mln
20.51%
jan 1, 2003
137.654 mln
+49.486 mln
56.13%
jan 1, 2004
153.799 mln
+16.145 mln
11.73%
jan 1, 2005
155.463 mln
+1.665 mln
1.08%
jan 1, 2006
177.186 mln
+21.723 mln
13.97%
jan 1, 2007
211.842 mln
+34.656 mln
19.56%
jan 1, 2008
343.921 mln
+132.079 mln
62.35%
jan 1, 2009
430.991 mln
+87.07 mln
25.32%
jan 1, 2010
453.74 mln
+22.749 mln
5.28%
jan 1, 2011
472.746 mln
+19.005 mln
4.19%
jan 1, 2012
784.108 mln
+311.362 mln
65.86%
jan 1, 2013
827.464 mln
+43.356 mln
5.53%
jan 1, 2014
894.509 mln
+67.045 mln
8.1%
jan 1, 2015
920.265 mln
+25.756 mln
2.88%
jan 1, 2016
894.509 mln
-25.756 mln
-2.8%
Ranking of countries by current statistics by years


Comments: