29
/
en
AIzaSyAYiBZKx7MnpbEhh9jyipgxe19OcubqV5w
April 1, 2024
214686
Norway
NOR
true
2
1
Personal remittances, received (current US$)
2016,2015,2014,2013,2012,2011,2010,2009,2008,2007,2006,2005,2004,2003,2002,2001,2000,1999,1998,1997,1996,1995,1994,1993,1992,1991,1990,1989,1988,1987,1986,1985,1984,1983,1982,1981,1980,1979,1978,1977,1976
This statistics in other country:
AfghanistanAlbaniaAlgeriaAngolaAntigua and BarbudaArab WorldArgentinaArmeniaArubaAustraliaAustriaAzerbaijanBangladeshBarbadosBelarusBelgiumBelizeBeninBermudaBhutanBoliviaBosnia and HerzegovinaBotswanaBrazilBulgariaBurkina FasoBurundiCabo VerdeCambodiaCameroonCanadaCaribbean small statesCentral African RepublicCentral Europe and the BalticsChadChileChinaColombiaComorosCongo, Dem. Rep.Congo, Rep.Costa RicaCote d'IvoireCroatiaCuracaoCyprusCzech RepublicDenmarkDjiboutiDominicaDominican RepublicEarly-demographic dividendEast Asia & PacificEast Asia & Pacific (excluding high income)East Asia & Pacific (IDA & IBRD countries)EcuadorEgypt, Arab Rep.El SalvadorEquatorial GuineaEritreaEstoniaEthiopiaEuro areaEurope & Central AsiaEurope & Central Asia (excluding high income)Europe & Central Asia (IDA & IBRD countries)European UnionFaroe IslandsFijiFinlandFragile and conflict affected situationsFranceFrench PolynesiaGabonGambia, TheGeorgiaGermanyGhanaGreeceGrenadaGuatemalaGuineaGuinea-BissauGuyanaHaitiHeavily indebted poor countries (HIPC)High incomeHondurasHong Kong SAR, ChinaHungaryIBRD onlyIcelandIDA & IBRD totalIDA blendIDA onlyIDA totalIndiaIndonesiaIran, Islamic Rep.IraqIrelandIsraelItalyJamaicaJapanJordanKazakhstanKenyaKiribatiKorea, Rep.KosovoKuwaitKyrgyz RepublicLao PDRLate-demographic dividendLatin America & Caribbean Latin America & Caribbean (excluding high income)Latin America & the Caribbean (IDA & IBRD countries)LatviaLeast developed countries: UN classificationLebanonLesothoLiberiaLibyaLithuaniaLow & middle incomeLow incomeLower middle incomeLuxembourgMacao SAR, ChinaMacedonia, FYRMadagascarMalawiMalaysiaMaldivesMaliMaltaMarshall IslandsMauritaniaMauritiusMexicoMicronesia, Fed. Sts.Middle East & North AfricaMiddle East & North Africa (excluding high income)Middle East & North Africa (IDA & IBRD countries)Middle incomeMoldovaMongoliaMontenegroMoroccoMozambiqueMyanmarNamibiaNepalNetherlandsNew CaledoniaNew ZealandNicaraguaNigerNigeriaNorth AmericaNorwayOECD membersOmanOther small statesPacific island small statesPakistanPalauPanamaPapua New GuineaParaguayPeruPhilippinesPolandPortugalPost-demographic dividendPre-demographic dividendQatarRomaniaRussian FederationRwandaSamoaSao Tome and PrincipeSaudi ArabiaSenegalSerbiaSeychellesSierra LeoneSint Maarten (Dutch part)Slovak RepublicSloveniaSmall statesSolomon IslandsSomaliaSouth AfricaSouth AsiaSouth Asia (IDA & IBRD)South SudanSpainSri LankaSt. Kitts and NevisSt. LuciaSt. Vincent and the GrenadinesSub-Saharan Africa Sub-Saharan Africa (excluding high income)Sub-Saharan Africa (IDA & IBRD countries)SudanSurinameSwazilandSwedenSwitzerlandSyrian Arab RepublicTajikistanTanzaniaThailandTimor-LesteTogoTongaTrinidad and TobagoTunisiaTurkeyTurkmenistanTuvaluUgandaUkraineUnited KingdomUnited StatesUpper middle incomeUruguayUzbekistanVanuatuVenezuela, RBVietnamWest Bank and GazaWorldYemen, Rep.ZambiaZimbabwe Timeline:
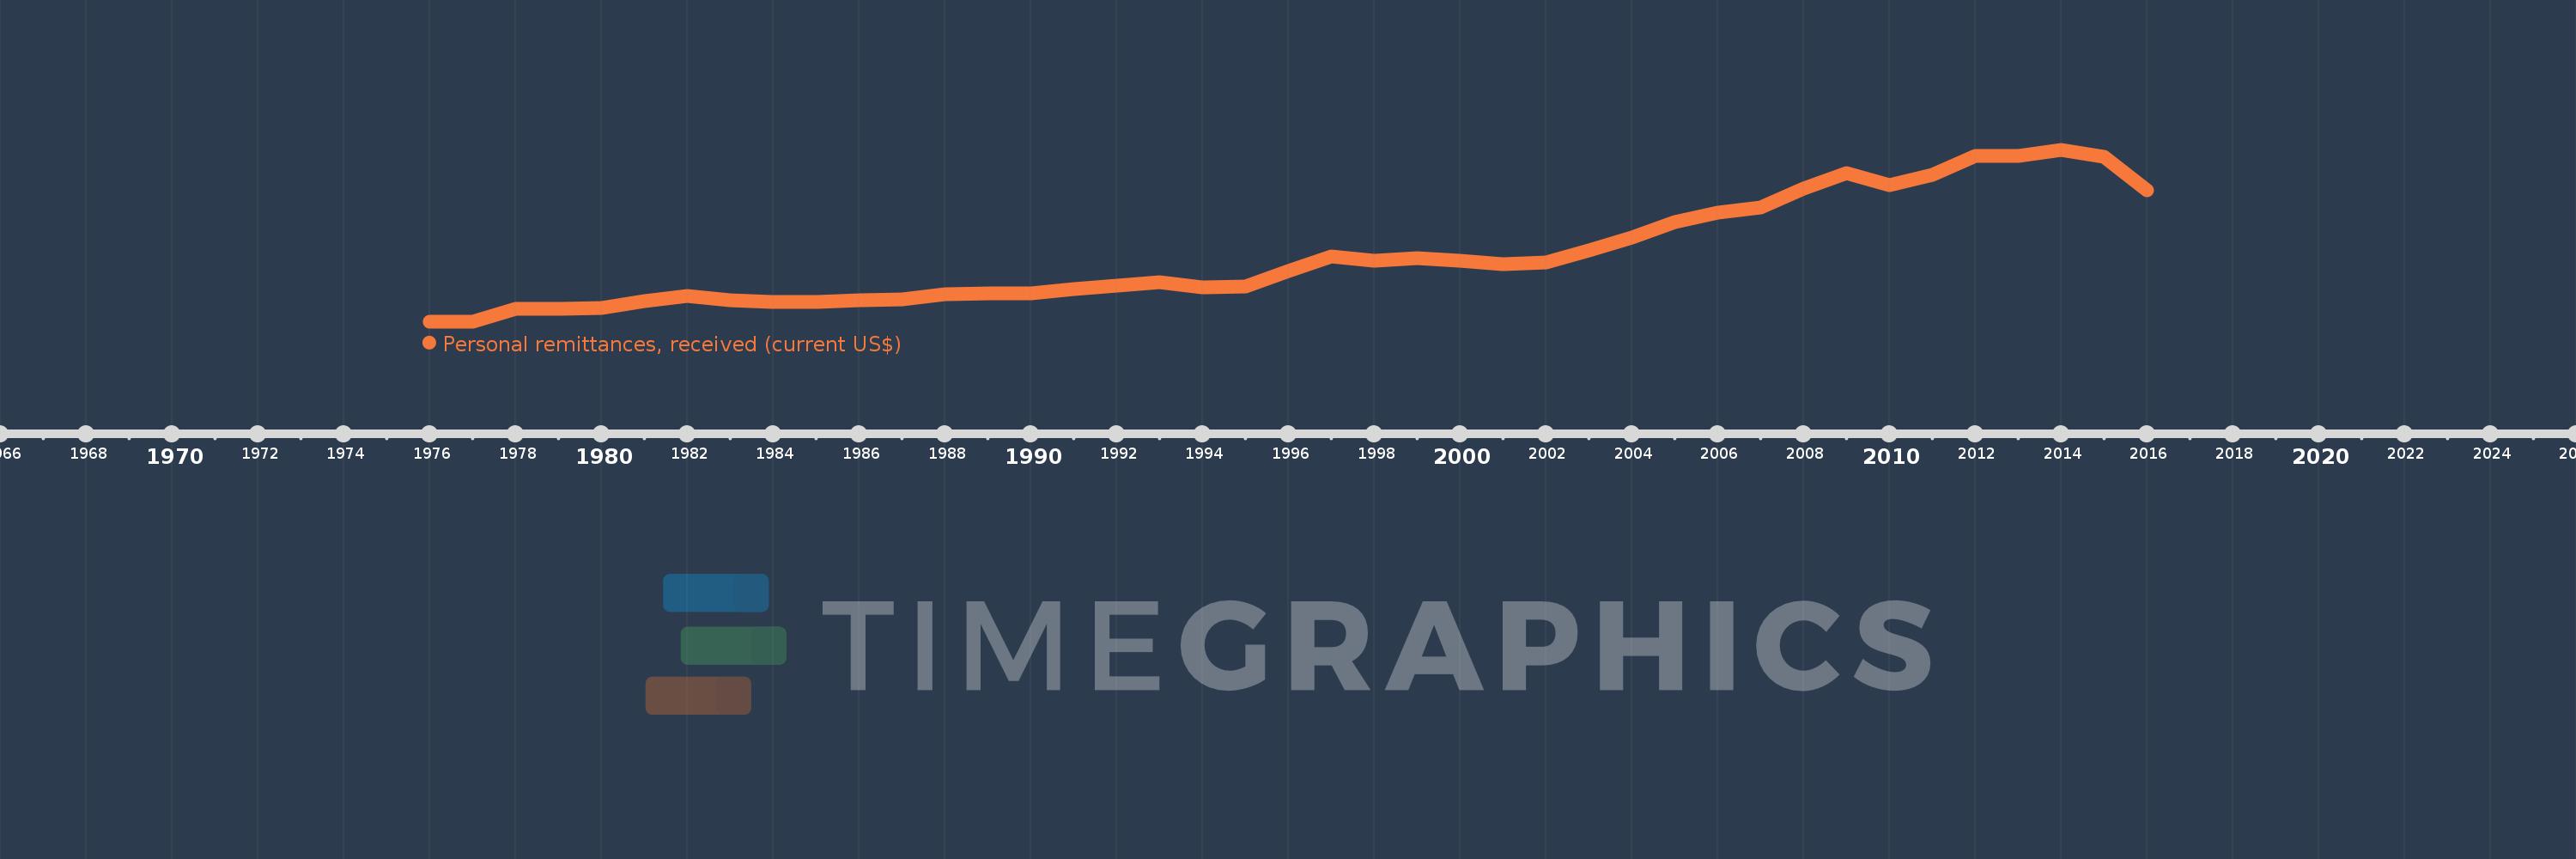
This timeline shows a graph from 1976 to 2016 of Norway. No data until 1975. Number of actual observations by date: 41.
Source name:
World Development Indicators
Source organization:
World Bank staff estimates based on IMF balance of payments data.
Categories, topics:
Economy & Growth, Financial Sector, External Debt
Last updated:
apr 23, 2017
Indicators value changes by year
Minimum:
8.055 mln
jan 1, 1976
Maximum:
791.458 mln
jan 1, 2014
At the date of observation
Value
Absolute change
Change from previous value
jan 1, 1976
8.055 mln
+8.055 mln
0.0%
jan 1, 1977
8.801 mln
+745.901K
9.26%
jan 1, 1978
66.183 mln
+57.382 mln
652.03%
jan 1, 1979
67.984 mln
+1.801 mln
2.72%
jan 1, 1980
73.067 mln
+5.083 mln
7.48%
jan 1, 1981
101.642 mln
+28.575 mln
39.11%
jan 1, 1982
125.045 mln
+23.404 mln
23.03%
jan 1, 1983
106.602 mln
-18.443 mln
-14.75%
jan 1, 1984
101.234 mln
-5.368 mln
-5.04%
jan 1, 1985
101.052 mln
-182.343K
-0.18%
jan 1, 1986
105.437 mln
+4.385 mln
4.34%
jan 1, 1987
110.846 mln
+5.409 mln
5.13%
jan 1, 1988
134.862 mln
+24.016 mln
21.67%
jan 1, 1989
137.937 mln
+3.075 mln
2.28%
jan 1, 1990
140.336 mln
+2.399 mln
1.74%
jan 1, 1991
157.824 mln
+17.488 mln
12.46%
jan 1, 1992
174.231 mln
+16.407 mln
10.4%
jan 1, 1993
189.878 mln
+15.648 mln
8.98%
jan 1, 1994
166.335 mln
-23.544 mln
-12.4%
jan 1, 1995
170.302 mln
+3.968 mln
2.39%
jan 1, 1996
238.739 mln
+68.437 mln
40.19%
jan 1, 1997
308.865 mln
+70.126 mln
29.37%
jan 1, 1998
288.916 mln
-19.949 mln
-6.46%
jan 1, 1999
300.609 mln
+11.693 mln
4.05%
jan 1, 2000
287.758 mln
-12.852 mln
-4.28%
jan 1, 2001
270.45 mln
-17.308 mln
-6.01%
jan 1, 2002
278.971 mln
+8.522 mln
3.15%
jan 1, 2003
332.635 mln
+53.664 mln
19.24%
jan 1, 2004
391.701 mln
+59.066 mln
17.76%
jan 1, 2005
464.972 mln
+73.272 mln
18.71%
jan 1, 2006
505.278 mln
+40.306 mln
8.67%
jan 1, 2007
528.833 mln
+23.555 mln
4.66%
jan 1, 2008
616.677 mln
+87.843 mln
16.61%
jan 1, 2009
684.971 mln
+68.294 mln
11.07%
jan 1, 2010
631.471 mln
-53.5 mln
-7.81%
jan 1, 2011
679.972 mln
+48.5 mln
7.68%
jan 1, 2012
764.994 mln
+85.023 mln
12.5%
jan 1, 2013
766.53 mln
+1.536 mln
0.2%
jan 1, 2014
791.458 mln
+24.928 mln
3.25%
jan 1, 2015
759.948 mln
-31.51 mln
-3.98%
jan 1, 2016
608.942 mln
-151.005 mln
-19.87%
Ranking of countries by current statistics by years


Comments: