29
/
en
AIzaSyAYiBZKx7MnpbEhh9jyipgxe19OcubqV5w
April 1, 2024
208314
Netherlands
NLD
true
2
1
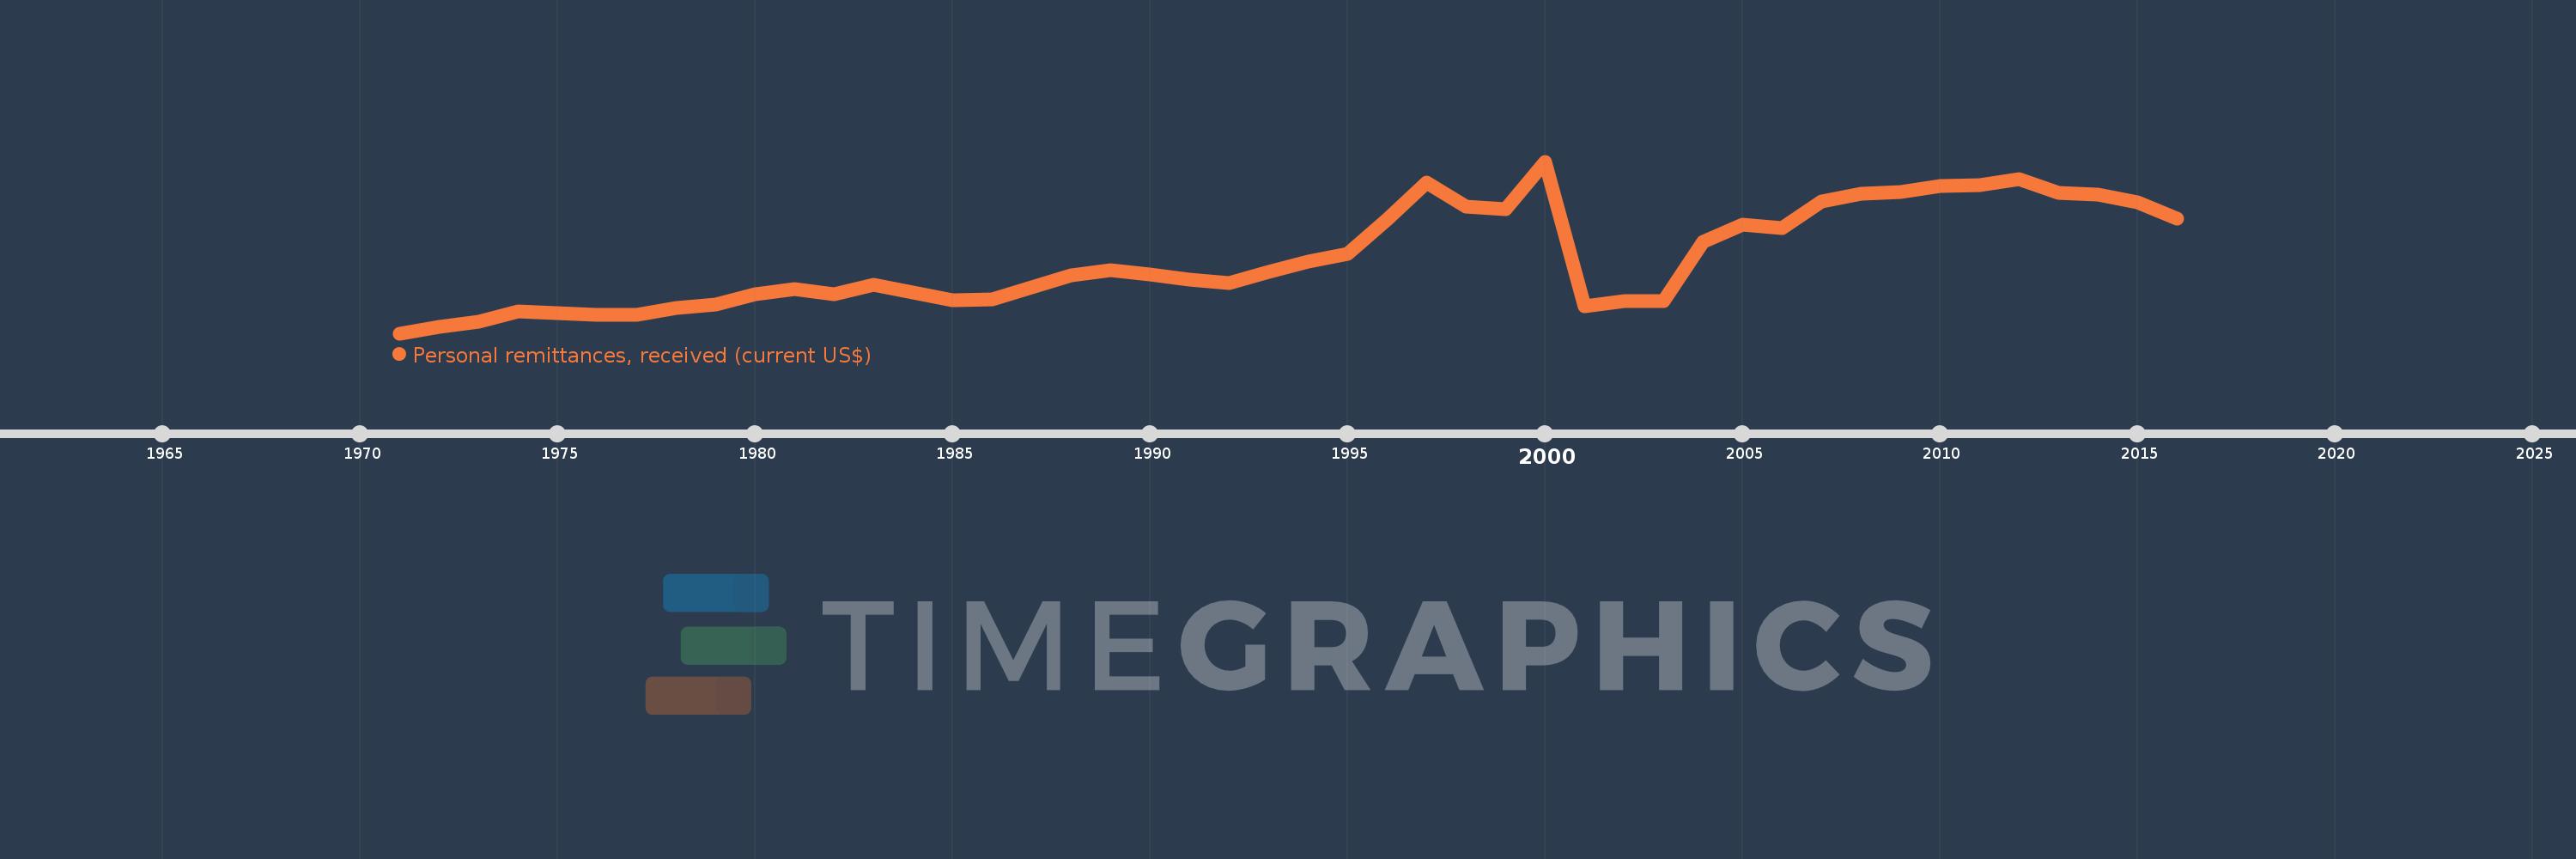
Personal remittances, received (current US$)
2016,2015,2014,2013,2012,2011,2010,2009,2008,2007,2006,2005,2004,2003,2002,2001,2000,1999,1998,1997,1996,1995,1994,1993,1992,1991,1990,1989,1988,1987,1986,1985,1984,1983,1982,1981,1980,1979,1978,1977,1976,1975,1974,1973,1972,1971
This statistics in other country:
AfghanistanAlbaniaAlgeriaAngolaAntigua and BarbudaArab WorldArgentinaArmeniaArubaAustraliaAustriaAzerbaijanBangladeshBarbadosBelarusBelgiumBelizeBeninBermudaBhutanBoliviaBosnia and HerzegovinaBotswanaBrazilBulgariaBurkina FasoBurundiCabo VerdeCambodiaCameroonCanadaCaribbean small statesCentral African RepublicCentral Europe and the BalticsChadChileChinaColombiaComorosCongo, Dem. Rep.Congo, Rep.Costa RicaCote d'IvoireCroatiaCuracaoCyprusCzech RepublicDenmarkDjiboutiDominicaDominican RepublicEarly-demographic dividendEast Asia & PacificEast Asia & Pacific (excluding high income)East Asia & Pacific (IDA & IBRD countries)EcuadorEgypt, Arab Rep.El SalvadorEquatorial GuineaEritreaEstoniaEthiopiaEuro areaEurope & Central AsiaEurope & Central Asia (excluding high income)Europe & Central Asia (IDA & IBRD countries)European UnionFaroe IslandsFijiFinlandFragile and conflict affected situationsFranceFrench PolynesiaGabonGambia, TheGeorgiaGermanyGhanaGreeceGrenadaGuatemalaGuineaGuinea-BissauGuyanaHaitiHeavily indebted poor countries (HIPC)High incomeHondurasHong Kong SAR, ChinaHungaryIBRD onlyIcelandIDA & IBRD totalIDA blendIDA onlyIDA totalIndiaIndonesiaIran, Islamic Rep.IraqIrelandIsraelItalyJamaicaJapanJordanKazakhstanKenyaKiribatiKorea, Rep.KosovoKuwaitKyrgyz RepublicLao PDRLate-demographic dividendLatin America & Caribbean Latin America & Caribbean (excluding high income)Latin America & the Caribbean (IDA & IBRD countries)LatviaLeast developed countries: UN classificationLebanonLesothoLiberiaLibyaLithuaniaLow & middle incomeLow incomeLower middle incomeLuxembourgMacao SAR, ChinaMacedonia, FYRMadagascarMalawiMalaysiaMaldivesMaliMaltaMarshall IslandsMauritaniaMauritiusMexicoMicronesia, Fed. Sts.Middle East & North AfricaMiddle East & North Africa (excluding high income)Middle East & North Africa (IDA & IBRD countries)Middle incomeMoldovaMongoliaMontenegroMoroccoMozambiqueMyanmarNamibiaNepalNetherlandsNew CaledoniaNew ZealandNicaraguaNigerNigeriaNorth AmericaNorwayOECD membersOmanOther small statesPacific island small statesPakistanPalauPanamaPapua New GuineaParaguayPeruPhilippinesPolandPortugalPost-demographic dividendPre-demographic dividendQatarRomaniaRussian FederationRwandaSamoaSao Tome and PrincipeSaudi ArabiaSenegalSerbiaSeychellesSierra LeoneSint Maarten (Dutch part)Slovak RepublicSloveniaSmall statesSolomon IslandsSomaliaSouth AfricaSouth AsiaSouth Asia (IDA & IBRD)South SudanSpainSri LankaSt. Kitts and NevisSt. LuciaSt. Vincent and the GrenadinesSub-Saharan Africa Sub-Saharan Africa (excluding high income)Sub-Saharan Africa (IDA & IBRD countries)SudanSurinameSwazilandSwedenSwitzerlandSyrian Arab RepublicTajikistanTanzaniaThailandTimor-LesteTogoTongaTrinidad and TobagoTunisiaTurkeyTurkmenistanTuvaluUgandaUkraineUnited KingdomUnited StatesUpper middle incomeUruguayUzbekistanVanuatuVenezuela, RBVietnamWest Bank and GazaWorldYemen, Rep.ZambiaZimbabwe Timeline:
This timeline shows a graph from 1971 to 2016 of Netherlands. No data until 1970. Number of actual observations by date: 46.
Source name:
World Development Indicators
Source organization:
World Bank staff estimates based on IMF balance of payments data.
Categories, topics:
Economy & Growth, Financial Sector, External Debt
Last updated:
apr 23, 2017
Indicators value changes by year
Minimum:
133.425 mln
jan 1, 1971
Maximum:
1.978 bln
jan 1, 2000
At the date of observation
Value
Absolute change
Change from previous value
jan 1, 1971
133.425 mln
+133.425 mln
0.0%
jan 1, 1972
203.13 mln
+69.705 mln
52.24%
jan 1, 1973
262.031 mln
+58.901 mln
29.0%
jan 1, 1974
367.419 mln
+105.387 mln
40.22%
jan 1, 1975
347.947 mln
-19.472 mln
-5.3%
jan 1, 1976
334.756 mln
-13.192 mln
-3.79%
jan 1, 1977
328.868 mln
-5.887 mln
-1.76%
jan 1, 1978
400.933 mln
+72.065 mln
21.91%
jan 1, 1979
446.557 mln
+45.625 mln
11.38%
jan 1, 1980
550.762 mln
+104.205 mln
23.34%
jan 1, 1981
604.357 mln
+53.595 mln
9.73%
jan 1, 1982
556.271 mln
-48.086 mln
-7.96%
jan 1, 1983
656.218 mln
+99.946 mln
17.97%
jan 1, 1984
567.022 mln
-89.196 mln
-13.59%
jan 1, 1985
492.894 mln
-74.128 mln
-13.07%
jan 1, 1986
501.53 mln
+8.636 mln
1.75%
jan 1, 1987
626.002 mln
+124.472 mln
24.82%
jan 1, 1988
753.309 mln
+127.308 mln
20.34%
jan 1, 1989
814.184 mln
+60.874 mln
8.08%
jan 1, 1990
768.754 mln
-45.43 mln
-5.58%
jan 1, 1991
708.941 mln
-59.812 mln
-7.78%
jan 1, 1992
672.399 mln
-36.542 mln
-5.15%
jan 1, 1993
792.31 mln
+119.911 mln
17.83%
jan 1, 1994
901.634 mln
+109.325 mln
13.8%
jan 1, 1995
984.061 mln
+82.426 mln
9.14%
jan 1, 1996
1.359 bln
+374.804 mln
38.09%
jan 1, 1997
1.754 bln
+394.838 mln
29.06%
jan 1, 1998
1.495 bln
-258.638 mln
-14.75%
jan 1, 1999
1.464 bln
-31.305 mln
-2.09%
jan 1, 2000
1.978 bln
+514.111 mln
35.12%
jan 1, 2001
425.82 mln
-1.552 bln
-78.47%
jan 1, 2002
482.625 mln
+56.805 mln
13.34%
jan 1, 2003
483.649 mln
+1.024 mln
0.21%
jan 1, 2004
1.12 bln
+635.883 mln
131.48%
jan 1, 2005
1.297 bln
+177.793 mln
15.88%
jan 1, 2006
1.259 bln
-37.987 mln
-2.93%
jan 1, 2007
1.552 bln
+292.615 mln
23.24%
jan 1, 2008
1.63 bln
+78.499 mln
5.06%
jan 1, 2009
1.649 bln
+18.644 mln
1.14%
jan 1, 2010
1.712 bln
+62.674 mln
3.8%
jan 1, 2011
1.72 bln
+8.667 mln
0.51%
jan 1, 2012
1.788 bln
+67.169 mln
3.9%
jan 1, 2013
1.641 bln
-146.884 mln
-8.22%
jan 1, 2014
1.619 bln
-22.056 mln
-1.34%
jan 1, 2015
1.541 bln
-77.984 mln
-4.82%
jan 1, 2016
1.365 bln
-175.853 mln
-11.41%
Ranking of countries by current statistics by years


Comments: