29
/
en
AIzaSyAYiBZKx7MnpbEhh9jyipgxe19OcubqV5w
April 1, 2024
84557
Benin
BEN
true
2
1
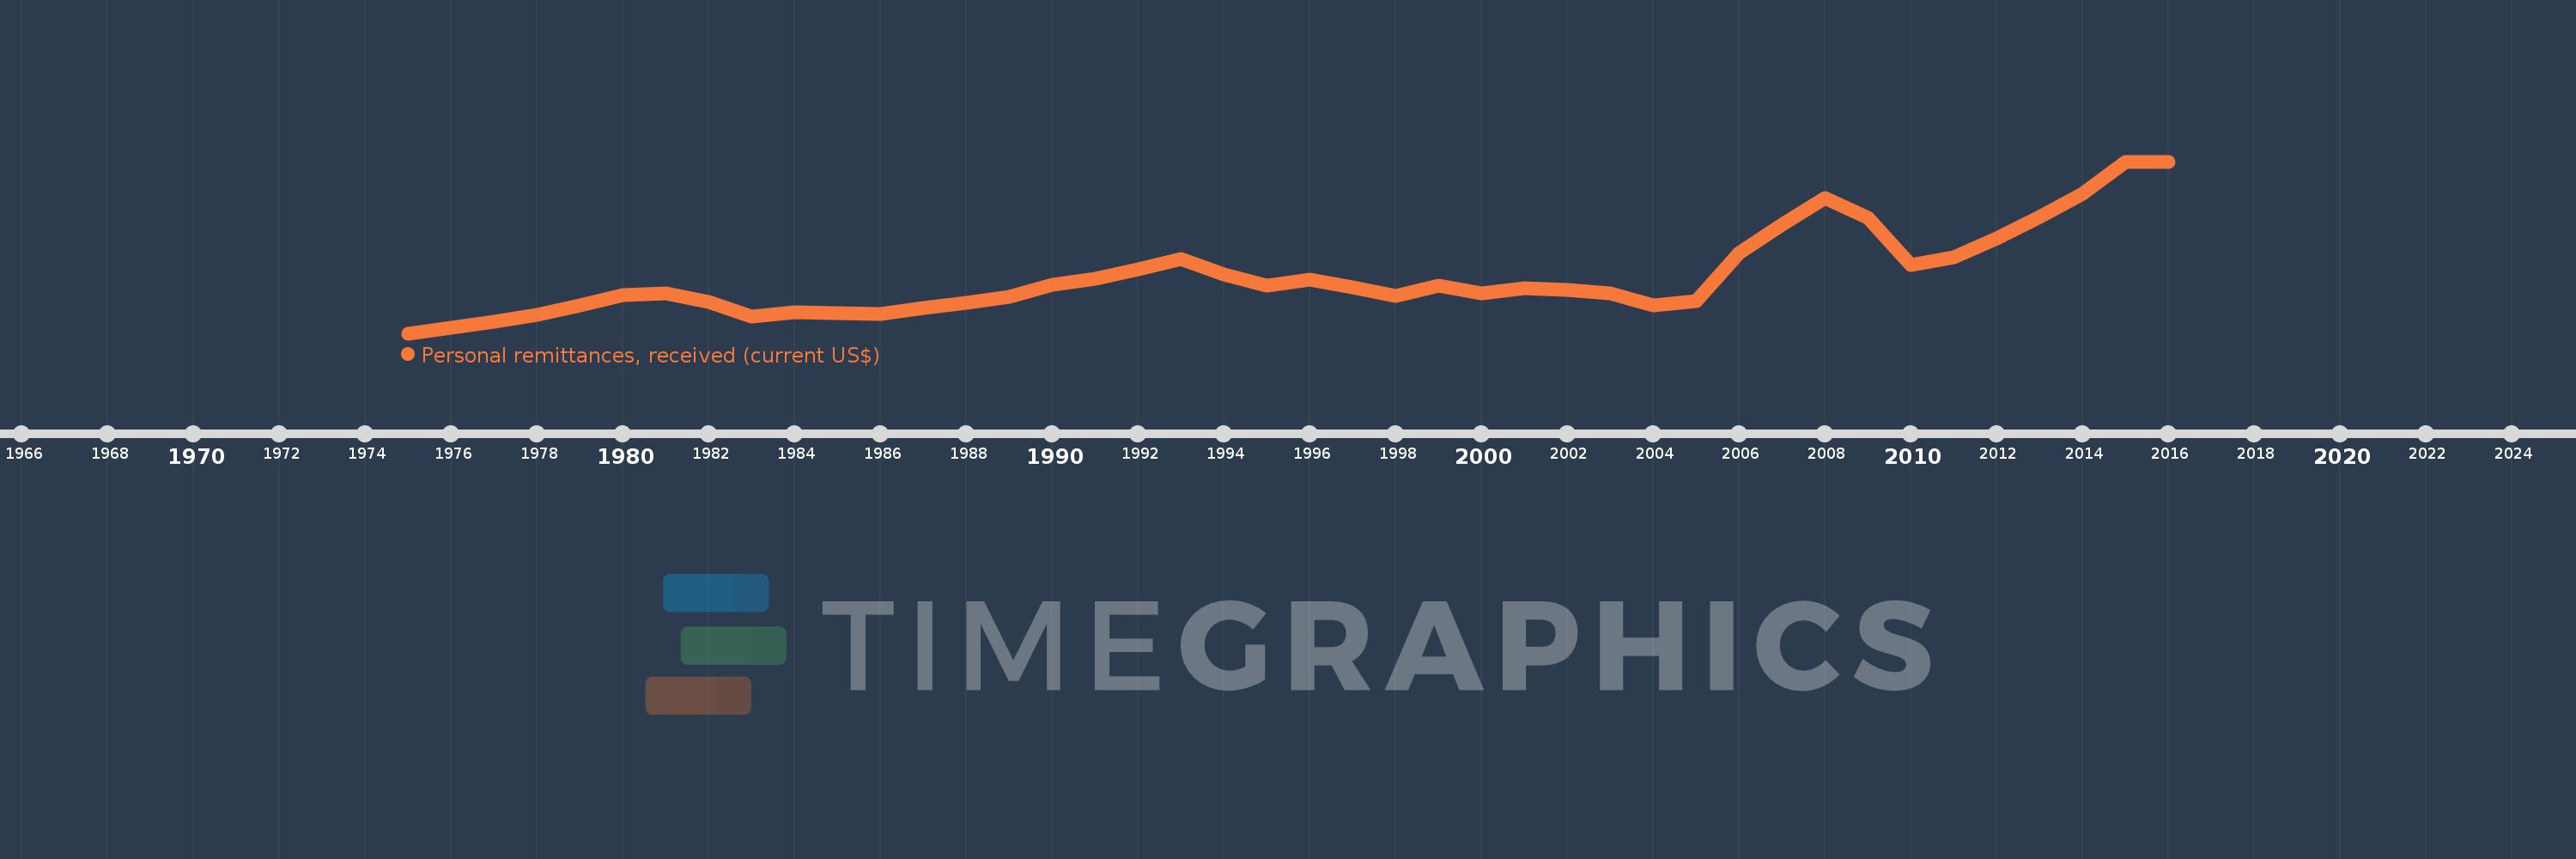
Personal remittances, received (current US$)
2016,2015,2014,2013,2012,2011,2010,2009,2008,2007,2006,2005,2004,2003,2002,2001,2000,1999,1998,1997,1996,1995,1994,1993,1992,1991,1990,1989,1988,1987,1986,1985,1984,1983,1982,1981,1980,1979,1978,1977,1976,1975
This statistics in other country:
AfghanistanAlbaniaAlgeriaAngolaAntigua and BarbudaArab WorldArgentinaArmeniaArubaAustraliaAustriaAzerbaijanBangladeshBarbadosBelarusBelgiumBelizeBeninBermudaBhutanBoliviaBosnia and HerzegovinaBotswanaBrazilBulgariaBurkina FasoBurundiCabo VerdeCambodiaCameroonCanadaCaribbean small statesCentral African RepublicCentral Europe and the BalticsChadChileChinaColombiaComorosCongo, Dem. Rep.Congo, Rep.Costa RicaCote d'IvoireCroatiaCuracaoCyprusCzech RepublicDenmarkDjiboutiDominicaDominican RepublicEarly-demographic dividendEast Asia & PacificEast Asia & Pacific (excluding high income)East Asia & Pacific (IDA & IBRD countries)EcuadorEgypt, Arab Rep.El SalvadorEquatorial GuineaEritreaEstoniaEthiopiaEuro areaEurope & Central AsiaEurope & Central Asia (excluding high income)Europe & Central Asia (IDA & IBRD countries)European UnionFaroe IslandsFijiFinlandFragile and conflict affected situationsFranceFrench PolynesiaGabonGambia, TheGeorgiaGermanyGhanaGreeceGrenadaGuatemalaGuineaGuinea-BissauGuyanaHaitiHeavily indebted poor countries (HIPC)High incomeHondurasHong Kong SAR, ChinaHungaryIBRD onlyIcelandIDA & IBRD totalIDA blendIDA onlyIDA totalIndiaIndonesiaIran, Islamic Rep.IraqIrelandIsraelItalyJamaicaJapanJordanKazakhstanKenyaKiribatiKorea, Rep.KosovoKuwaitKyrgyz RepublicLao PDRLate-demographic dividendLatin America & Caribbean Latin America & Caribbean (excluding high income)Latin America & the Caribbean (IDA & IBRD countries)LatviaLeast developed countries: UN classificationLebanonLesothoLiberiaLibyaLithuaniaLow & middle incomeLow incomeLower middle incomeLuxembourgMacao SAR, ChinaMacedonia, FYRMadagascarMalawiMalaysiaMaldivesMaliMaltaMarshall IslandsMauritaniaMauritiusMexicoMicronesia, Fed. Sts.Middle East & North AfricaMiddle East & North Africa (excluding high income)Middle East & North Africa (IDA & IBRD countries)Middle incomeMoldovaMongoliaMontenegroMoroccoMozambiqueMyanmarNamibiaNepalNetherlandsNew CaledoniaNew ZealandNicaraguaNigerNigeriaNorth AmericaNorwayOECD membersOmanOther small statesPacific island small statesPakistanPalauPanamaPapua New GuineaParaguayPeruPhilippinesPolandPortugalPost-demographic dividendPre-demographic dividendQatarRomaniaRussian FederationRwandaSamoaSao Tome and PrincipeSaudi ArabiaSenegalSerbiaSeychellesSierra LeoneSint Maarten (Dutch part)Slovak RepublicSloveniaSmall statesSolomon IslandsSomaliaSouth AfricaSouth AsiaSouth Asia (IDA & IBRD)South SudanSpainSri LankaSt. Kitts and NevisSt. LuciaSt. Vincent and the GrenadinesSub-Saharan Africa Sub-Saharan Africa (excluding high income)Sub-Saharan Africa (IDA & IBRD countries)SudanSurinameSwazilandSwedenSwitzerlandSyrian Arab RepublicTajikistanTanzaniaThailandTimor-LesteTogoTongaTrinidad and TobagoTunisiaTurkeyTurkmenistanTuvaluUgandaUkraineUnited KingdomUnited StatesUpper middle incomeUruguayUzbekistanVanuatuVenezuela, RBVietnamWest Bank and GazaWorldYemen, Rep.ZambiaZimbabwe Timeline:
This timeline shows a graph from 1975 to 2016 of Benin. No data until 1974. Number of actual observations by date: 42.
Source name:
World Development Indicators
Source organization:
World Bank staff estimates based on IMF balance of payments data.
Categories, topics:
Economy & Growth, Financial Sector, External Debt
Last updated:
apr 23, 2017
Indicators value changes by year
Minimum:
7.382 mln
jan 1, 1975
Maximum:
304.254 mln
jan 1, 2016
At the date of observation
Value
Absolute change
Change from previous value
jan 1, 1975
7.382 mln
+7.382 mln
0.0%
jan 1, 1976
17.591 mln
+10.209 mln
138.28%
jan 1, 1977
28.039 mln
+10.448 mln
59.39%
jan 1, 1978
39.181 mln
+11.142 mln
39.74%
jan 1, 1979
56.236 mln
+17.055 mln
43.53%
jan 1, 1980
72.922 mln
+16.686 mln
29.67%
jan 1, 1981
77.002 mln
+4.081 mln
5.6%
jan 1, 1982
62.006 mln
-14.996 mln
-19.47%
jan 1, 1983
36.95 mln
-25.056 mln
-40.41%
jan 1, 1984
43.845 mln
+6.895 mln
18.66%
jan 1, 1985
42.066 mln
-1.779 mln
-4.06%
jan 1, 1986
40.288 mln
-1.778 mln
-4.23%
jan 1, 1987
50.822 mln
+10.534 mln
26.15%
jan 1, 1988
60.226 mln
+9.403 mln
18.5%
jan 1, 1989
71.117 mln
+10.891 mln
18.08%
jan 1, 1990
91.336 mln
+20.22 mln
28.43%
jan 1, 1991
101.049 mln
+9.713 mln
10.63%
jan 1, 1992
117.971 mln
+16.921 mln
16.75%
jan 1, 1993
136.307 mln
+18.336 mln
15.54%
jan 1, 1994
108.894 mln
-27.413 mln
-20.11%
jan 1, 1995
89.482 mln
-19.412 mln
-17.83%
jan 1, 1996
100.134 mln
+10.652 mln
11.9%
jan 1, 1997
86.208 mln
-13.926 mln
-13.91%
jan 1, 1998
71.237 mln
-14.971 mln
-17.37%
jan 1, 1999
90.326 mln
+19.089 mln
26.8%
jan 1, 2000
76.648 mln
-13.678 mln
-15.14%
jan 1, 2001
85.663 mln
+9.015 mln
11.76%
jan 1, 2002
82.992 mln
-2.671 mln
-3.12%
jan 1, 2003
75.75 mln
-7.241 mln
-8.73%
jan 1, 2004
55.277 mln
-20.473 mln
-27.03%
jan 1, 2005
63.004 mln
+7.727 mln
13.98%
jan 1, 2006
146.881 mln
+83.877 mln
133.13%
jan 1, 2007
195.5 mln
+48.619 mln
33.1%
jan 1, 2008
240.476 mln
+44.976 mln
23.01%
jan 1, 2009
207.025 mln
-33.45 mln
-13.91%
jan 1, 2010
125.95 mln
-81.075 mln
-39.16%
jan 1, 2011
139.433 mln
+13.483 mln
10.7%
jan 1, 2012
171.96 mln
+32.527 mln
23.33%
jan 1, 2013
207.775 mln
+35.815 mln
20.83%
jan 1, 2014
248.73 mln
+40.954 mln
19.71%
jan 1, 2015
304.254 mln
+55.524 mln
22.32%
jan 1, 2016
304.254 mln
+0.034
0.0%
Ranking of countries by current statistics by years


Comments: