29
/
en
AIzaSyAYiBZKx7MnpbEhh9jyipgxe19OcubqV5w
April 1, 2024
97776
Cabo Verde
CPV
true
2
1
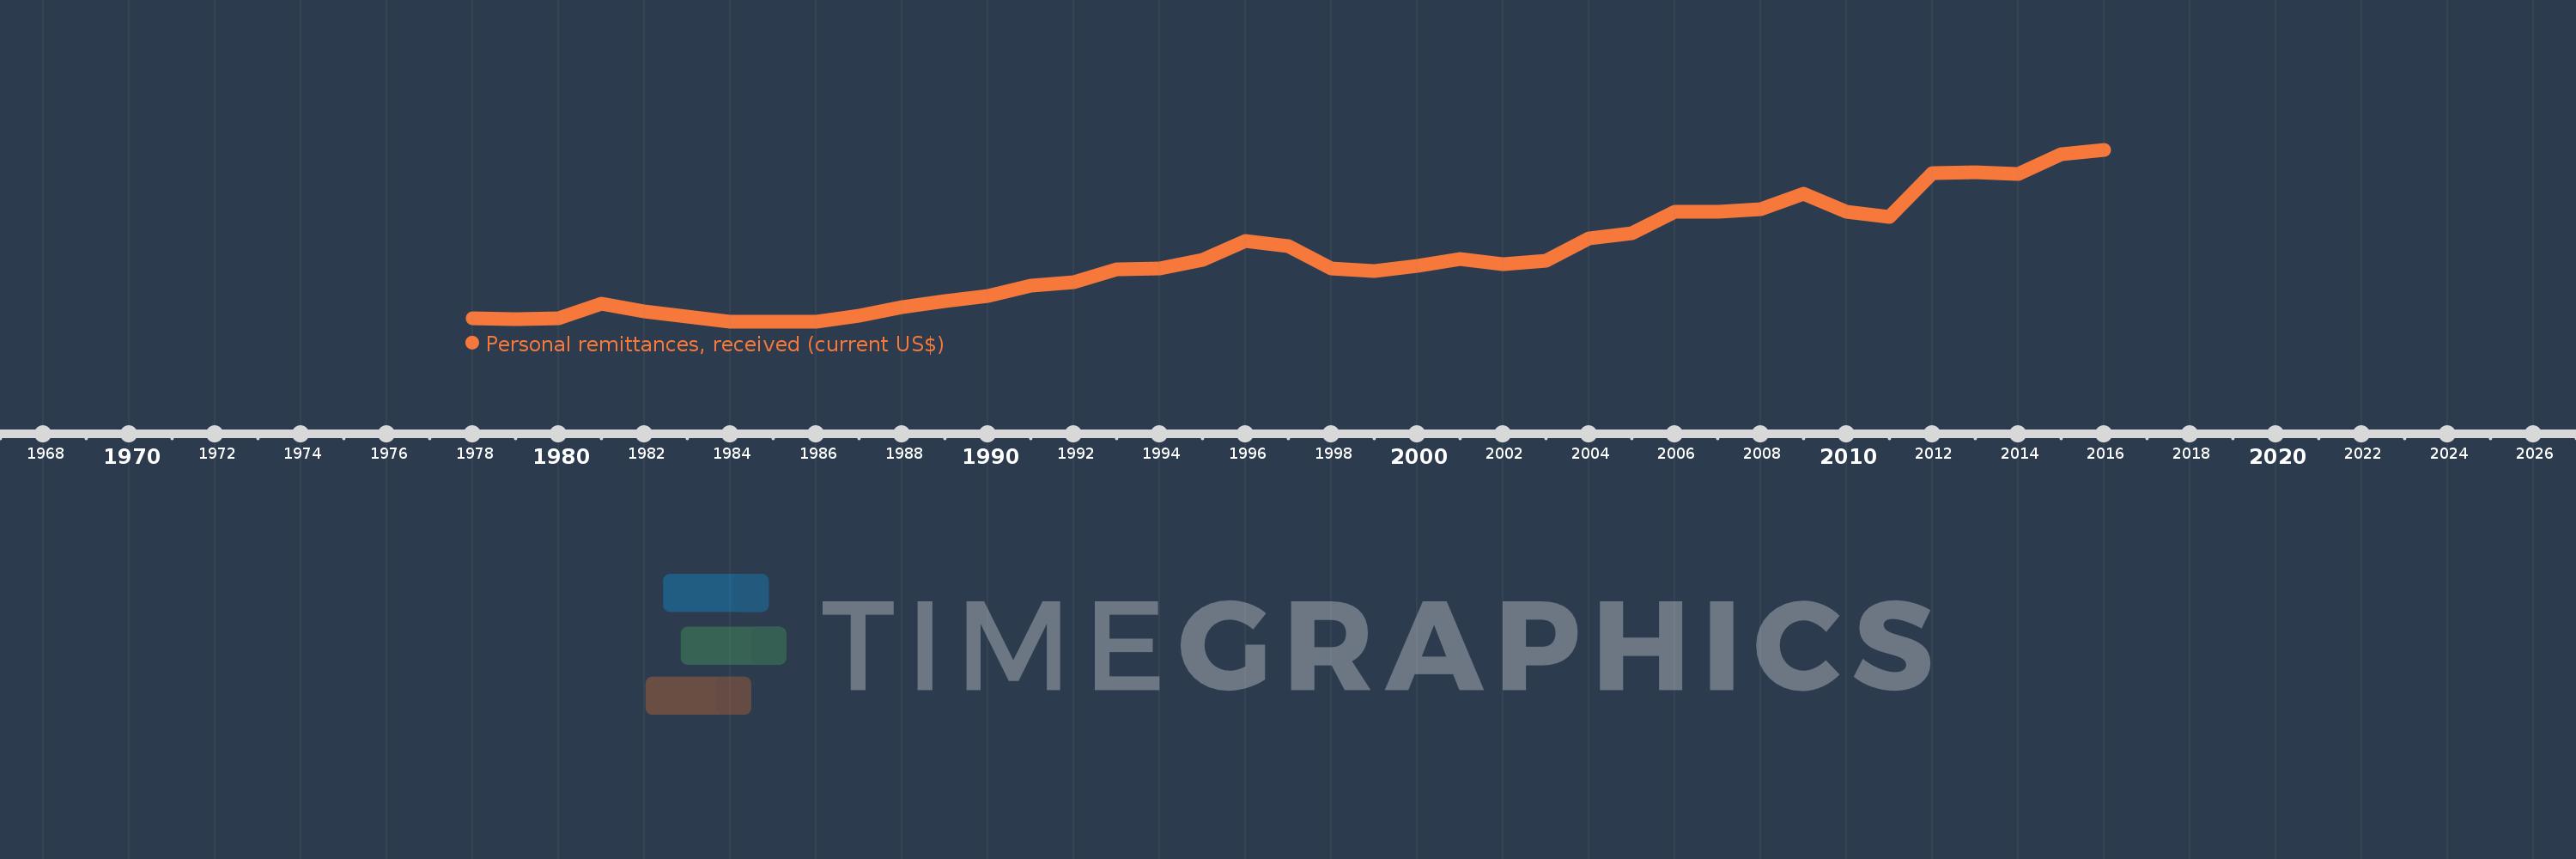
Personal remittances, received (current US$)
2016,2015,2014,2013,2012,2011,2010,2009,2008,2007,2006,2005,2004,2003,2002,2001,2000,1999,1998,1997,1996,1995,1994,1993,1992,1991,1990,1989,1988,1987,1986,1985,1984,1983,1982,1981,1980,1979,1978
This statistics in other country:
AfghanistanAlbaniaAlgeriaAngolaAntigua and BarbudaArab WorldArgentinaArmeniaArubaAustraliaAustriaAzerbaijanBangladeshBarbadosBelarusBelgiumBelizeBeninBermudaBhutanBoliviaBosnia and HerzegovinaBotswanaBrazilBulgariaBurkina FasoBurundiCabo VerdeCambodiaCameroonCanadaCaribbean small statesCentral African RepublicCentral Europe and the BalticsChadChileChinaColombiaComorosCongo, Dem. Rep.Congo, Rep.Costa RicaCote d'IvoireCroatiaCuracaoCyprusCzech RepublicDenmarkDjiboutiDominicaDominican RepublicEarly-demographic dividendEast Asia & PacificEast Asia & Pacific (excluding high income)East Asia & Pacific (IDA & IBRD countries)EcuadorEgypt, Arab Rep.El SalvadorEquatorial GuineaEritreaEstoniaEthiopiaEuro areaEurope & Central AsiaEurope & Central Asia (excluding high income)Europe & Central Asia (IDA & IBRD countries)European UnionFaroe IslandsFijiFinlandFragile and conflict affected situationsFranceFrench PolynesiaGabonGambia, TheGeorgiaGermanyGhanaGreeceGrenadaGuatemalaGuineaGuinea-BissauGuyanaHaitiHeavily indebted poor countries (HIPC)High incomeHondurasHong Kong SAR, ChinaHungaryIBRD onlyIcelandIDA & IBRD totalIDA blendIDA onlyIDA totalIndiaIndonesiaIran, Islamic Rep.IraqIrelandIsraelItalyJamaicaJapanJordanKazakhstanKenyaKiribatiKorea, Rep.KosovoKuwaitKyrgyz RepublicLao PDRLate-demographic dividendLatin America & Caribbean Latin America & Caribbean (excluding high income)Latin America & the Caribbean (IDA & IBRD countries)LatviaLeast developed countries: UN classificationLebanonLesothoLiberiaLibyaLithuaniaLow & middle incomeLow incomeLower middle incomeLuxembourgMacao SAR, ChinaMacedonia, FYRMadagascarMalawiMalaysiaMaldivesMaliMaltaMarshall IslandsMauritaniaMauritiusMexicoMicronesia, Fed. Sts.Middle East & North AfricaMiddle East & North Africa (excluding high income)Middle East & North Africa (IDA & IBRD countries)Middle incomeMoldovaMongoliaMontenegroMoroccoMozambiqueMyanmarNamibiaNepalNetherlandsNew CaledoniaNew ZealandNicaraguaNigerNigeriaNorth AmericaNorwayOECD membersOmanOther small statesPacific island small statesPakistanPalauPanamaPapua New GuineaParaguayPeruPhilippinesPolandPortugalPost-demographic dividendPre-demographic dividendQatarRomaniaRussian FederationRwandaSamoaSao Tome and PrincipeSaudi ArabiaSenegalSerbiaSeychellesSierra LeoneSint Maarten (Dutch part)Slovak RepublicSloveniaSmall statesSolomon IslandsSomaliaSouth AfricaSouth AsiaSouth Asia (IDA & IBRD)South SudanSpainSri LankaSt. Kitts and NevisSt. LuciaSt. Vincent and the GrenadinesSub-Saharan Africa Sub-Saharan Africa (excluding high income)Sub-Saharan Africa (IDA & IBRD countries)SudanSurinameSwazilandSwedenSwitzerlandSyrian Arab RepublicTajikistanTanzaniaThailandTimor-LesteTogoTongaTrinidad and TobagoTunisiaTurkeyTurkmenistanTuvaluUgandaUkraineUnited KingdomUnited StatesUpper middle incomeUruguayUzbekistanVanuatuVenezuela, RBVietnamWest Bank and GazaWorldYemen, Rep.ZambiaZimbabwe Timeline:
This timeline shows a graph from 1978 to 2016 of Cabo Verde. No data until 1977. Number of actual observations by date: 39.
Source name:
World Development Indicators
Source organization:
World Bank staff estimates based on IMF balance of payments data.
Categories, topics:
Economy & Growth, Financial Sector, External Debt
Last updated:
apr 23, 2017
Indicators value changes by year
Minimum:
20.548 mln
jan 1, 1984
Maximum:
201.005 mln
jan 1, 2016
At the date of observation
Value
Absolute change
Change from previous value
jan 1, 1978
24.282 mln
+24.282 mln
0.0%
jan 1, 1979
23.602 mln
-679.186K
-2.8%
jan 1, 1980
24.006 mln
+403.238K
1.71%
jan 1, 1981
40.065 mln
+16.059 mln
66.9%
jan 1, 1982
31.597 mln
-8.468 mln
-21.14%
jan 1, 1983
25.852 mln
-5.745 mln
-18.18%
jan 1, 1984
20.548 mln
-5.304 mln
-20.52%
jan 1, 1985
20.618 mln
+69.855K
0.34%
jan 1, 1986
20.757 mln
+139.17K
0.67%
jan 1, 1987
27.56 mln
+6.803 mln
32.77%
jan 1, 1988
36.426 mln
+8.866 mln
32.17%
jan 1, 1989
42.742 mln
+6.316 mln
17.34%
jan 1, 1990
47.7 mln
+4.958 mln
11.6%
jan 1, 1991
59.14 mln
+11.44 mln
23.98%
jan 1, 1992
62.367 mln
+3.226 mln
5.46%
jan 1, 1993
76.013 mln
+13.646 mln
21.88%
jan 1, 1994
76.491 mln
+478.371K
0.63%
jan 1, 1995
85.454 mln
+8.962 mln
11.72%
jan 1, 1996
105.861 mln
+20.407 mln
23.88%
jan 1, 1997
100.35 mln
-5.511 mln
-5.21%
jan 1, 1998
76.417 mln
-23.933 mln
-23.85%
jan 1, 1999
73.742 mln
-2.675 mln
-3.5%
jan 1, 2000
79.103 mln
+5.361 mln
7.27%
jan 1, 2001
86.906 mln
+7.803 mln
9.86%
jan 1, 2002
80.947 mln
-5.959 mln
-6.86%
jan 1, 2003
85.08 mln
+4.133 mln
5.11%
jan 1, 2004
108.538 mln
+23.458 mln
27.57%
jan 1, 2005
113.357 mln
+4.819 mln
4.44%
jan 1, 2006
136.649 mln
+23.292 mln
20.55%
jan 1, 2007
136.612 mln
-36.424K
-0.03%
jan 1, 2008
138.874 mln
+2.262 mln
1.66%
jan 1, 2009
155.111 mln
+16.237 mln
11.69%
jan 1, 2010
136.749 mln
-18.363 mln
-11.84%
jan 1, 2011
130.953 mln
-5.795 mln
-4.24%
jan 1, 2012
176.77 mln
+45.817 mln
34.99%
jan 1, 2013
177.953 mln
+1.184 mln
0.67%
jan 1, 2014
175.965 mln
-1.988 mln
-1.12%
jan 1, 2015
196.788 mln
+20.822 mln
11.83%
jan 1, 2016
201.005 mln
+4.217 mln
2.14%
Ranking of countries by current statistics by years


Comments: