29
/
en
AIzaSyAYiBZKx7MnpbEhh9jyipgxe19OcubqV5w
April 1, 2024
252293
St. Vincent and the Grenadines
VCT
true
2
1
Personal remittances, received (current US$)
2016,2015,2014,2013,2012,2011,2010,2009,2008,2007,2006,2005,2004,2003,2002,2001,2000,1999,1998,1997,1996,1995,1994,1993,1992,1991,1990,1989,1988,1987
This statistics in other country:
AfghanistanAlbaniaAlgeriaAngolaAntigua and BarbudaArab WorldArgentinaArmeniaArubaAustraliaAustriaAzerbaijanBangladeshBarbadosBelarusBelgiumBelizeBeninBermudaBhutanBoliviaBosnia and HerzegovinaBotswanaBrazilBulgariaBurkina FasoBurundiCabo VerdeCambodiaCameroonCanadaCaribbean small statesCentral African RepublicCentral Europe and the BalticsChadChileChinaColombiaComorosCongo, Dem. Rep.Congo, Rep.Costa RicaCote d'IvoireCroatiaCuracaoCyprusCzech RepublicDenmarkDjiboutiDominicaDominican RepublicEarly-demographic dividendEast Asia & PacificEast Asia & Pacific (excluding high income)East Asia & Pacific (IDA & IBRD countries)EcuadorEgypt, Arab Rep.El SalvadorEquatorial GuineaEritreaEstoniaEthiopiaEuro areaEurope & Central AsiaEurope & Central Asia (excluding high income)Europe & Central Asia (IDA & IBRD countries)European UnionFaroe IslandsFijiFinlandFragile and conflict affected situationsFranceFrench PolynesiaGabonGambia, TheGeorgiaGermanyGhanaGreeceGrenadaGuatemalaGuineaGuinea-BissauGuyanaHaitiHeavily indebted poor countries (HIPC)High incomeHondurasHong Kong SAR, ChinaHungaryIBRD onlyIcelandIDA & IBRD totalIDA blendIDA onlyIDA totalIndiaIndonesiaIran, Islamic Rep.IraqIrelandIsraelItalyJamaicaJapanJordanKazakhstanKenyaKiribatiKorea, Rep.KosovoKuwaitKyrgyz RepublicLao PDRLate-demographic dividendLatin America & Caribbean Latin America & Caribbean (excluding high income)Latin America & the Caribbean (IDA & IBRD countries)LatviaLeast developed countries: UN classificationLebanonLesothoLiberiaLibyaLithuaniaLow & middle incomeLow incomeLower middle incomeLuxembourgMacao SAR, ChinaMacedonia, FYRMadagascarMalawiMalaysiaMaldivesMaliMaltaMarshall IslandsMauritaniaMauritiusMexicoMicronesia, Fed. Sts.Middle East & North AfricaMiddle East & North Africa (excluding high income)Middle East & North Africa (IDA & IBRD countries)Middle incomeMoldovaMongoliaMontenegroMoroccoMozambiqueMyanmarNamibiaNepalNetherlandsNew CaledoniaNew ZealandNicaraguaNigerNigeriaNorth AmericaNorwayOECD membersOmanOther small statesPacific island small statesPakistanPalauPanamaPapua New GuineaParaguayPeruPhilippinesPolandPortugalPost-demographic dividendPre-demographic dividendQatarRomaniaRussian FederationRwandaSamoaSao Tome and PrincipeSaudi ArabiaSenegalSerbiaSeychellesSierra LeoneSint Maarten (Dutch part)Slovak RepublicSloveniaSmall statesSolomon IslandsSomaliaSouth AfricaSouth AsiaSouth Asia (IDA & IBRD)South SudanSpainSri LankaSt. Kitts and NevisSt. LuciaSt. Vincent and the GrenadinesSub-Saharan Africa Sub-Saharan Africa (excluding high income)Sub-Saharan Africa (IDA & IBRD countries)SudanSurinameSwazilandSwedenSwitzerlandSyrian Arab RepublicTajikistanTanzaniaThailandTimor-LesteTogoTongaTrinidad and TobagoTunisiaTurkeyTurkmenistanTuvaluUgandaUkraineUnited KingdomUnited StatesUpper middle incomeUruguayUzbekistanVanuatuVenezuela, RBVietnamWest Bank and GazaWorldYemen, Rep.ZambiaZimbabwe Timeline:
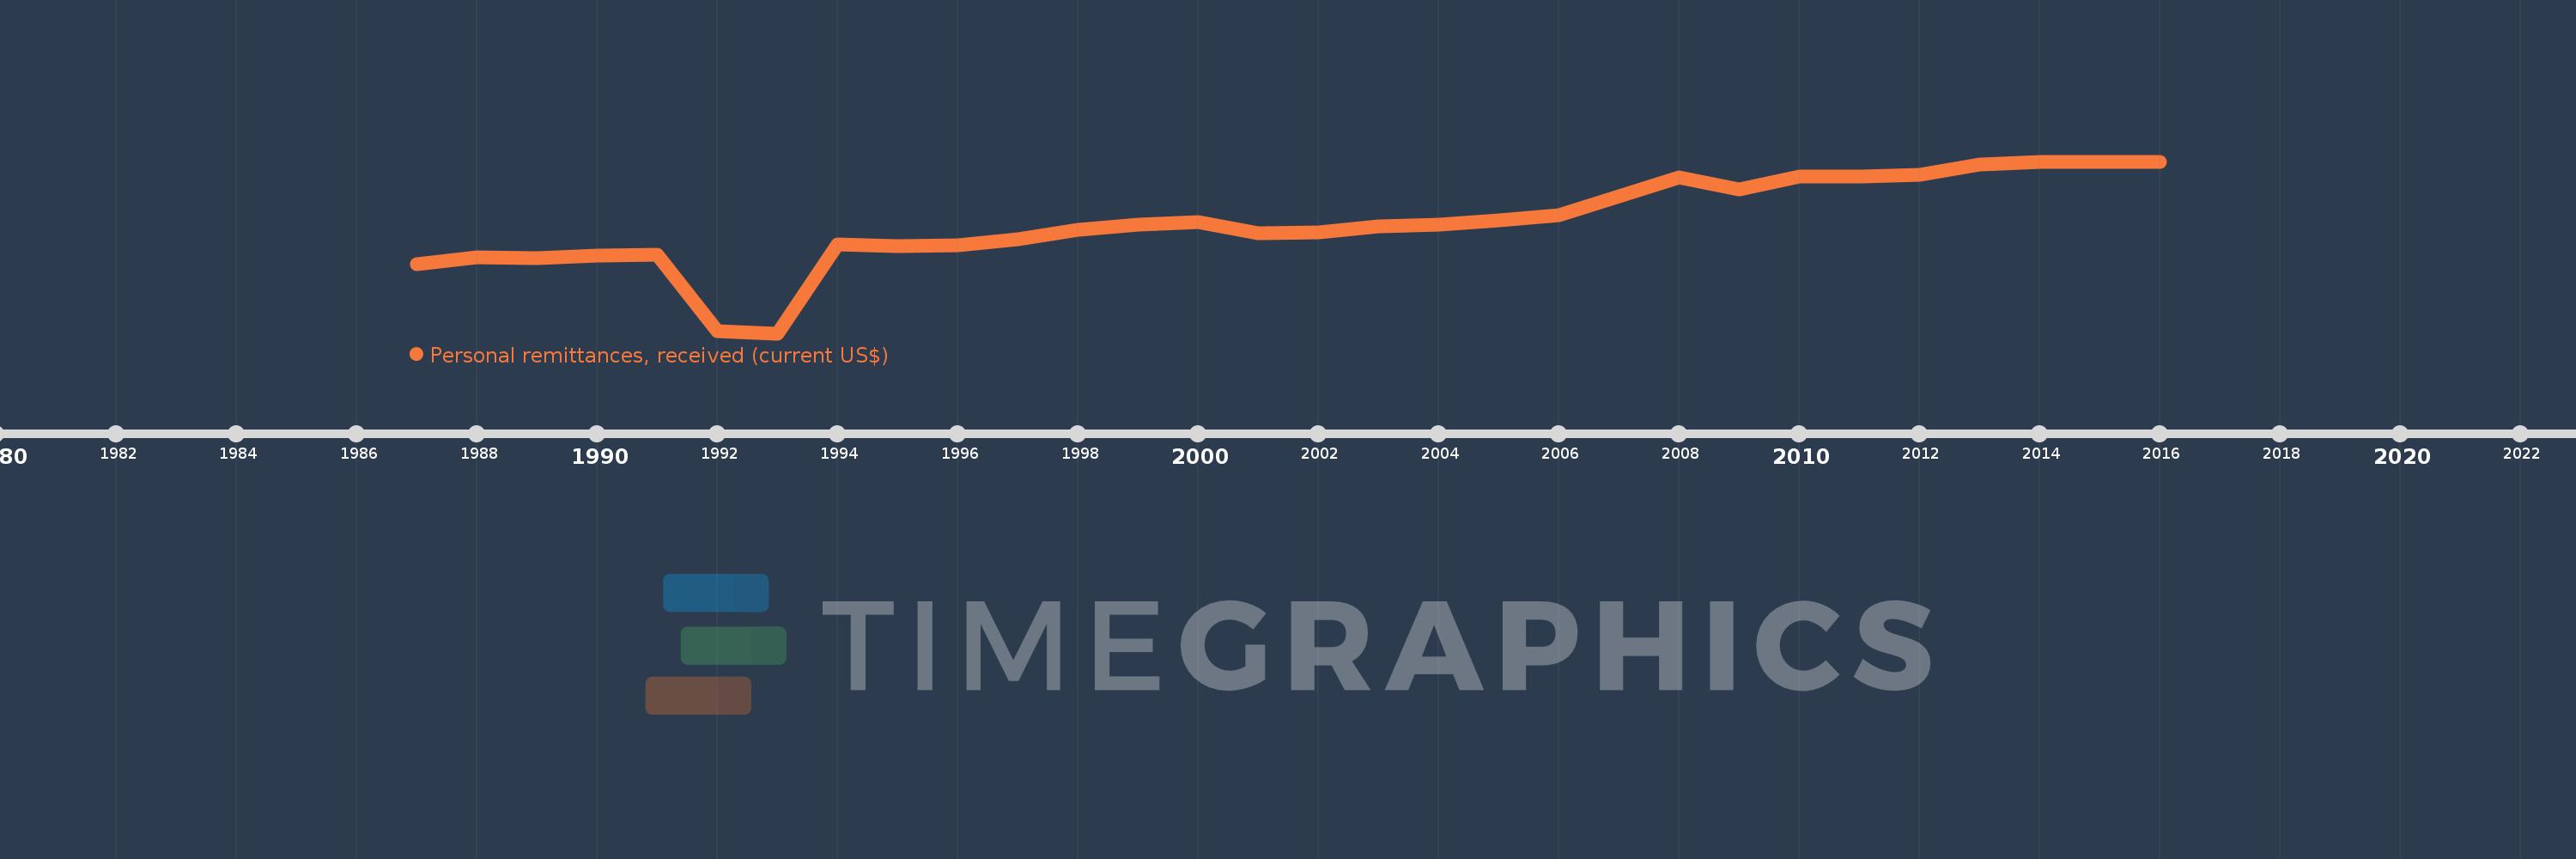
This timeline shows a graph from 1987 to 2016 of St. Vincent and the Grenadines. No data until 1986. Number of actual observations by date: 30.
Source name:
World Development Indicators
Source organization:
World Bank staff estimates based on IMF balance of payments data.
Categories, topics:
Economy & Growth, Financial Sector, External Debt
Last updated:
apr 23, 2017
Indicators value changes by year
Minimum:
2.041 mln
jan 1, 1993
Maximum:
31.588 mln
jan 1, 2014
At the date of observation
Value
Absolute change
Change from previous value
jan 1, 1987
13.889 mln
+13.889 mln
0.0%
jan 1, 1988
15.111 mln
+1.222 mln
8.8%
jan 1, 1989
14.963 mln
-148.148K
-0.98%
jan 1, 1990
15.37 mln
+407.407K
2.72%
jan 1, 1991
15.63 mln
+259.26K
1.69%
jan 1, 1992
2.448 mln
-13.181 mln
-84.34%
jan 1, 1993
2.041 mln
-407.408K
-16.64%
jan 1, 1994
17.393 mln
+15.352 mln
752.27%
jan 1, 1995
16.978 mln
-414.816K
-2.39%
jan 1, 1996
17.17 mln
+192.593K
1.13%
jan 1, 1997
18.174 mln
+1.004 mln
5.85%
jan 1, 1998
19.826 mln
+1.652 mln
9.09%
jan 1, 1999
20.8 mln
+974.073K
4.91%
jan 1, 2000
21.159 mln
+359.261K
1.73%
jan 1, 2001
19.293 mln
-1.867 mln
-8.82%
jan 1, 2002
19.453 mln
+160.741K
0.83%
jan 1, 2003
20.429 mln
+976.0K
5.02%
jan 1, 2004
20.7 mln
+270.585K
1.32%
jan 1, 2005
21.448 mln
+748.567K
3.62%
jan 1, 2006
22.417 mln
+969.011K
4.52%
jan 1, 2007
25.557 mln
+3.14 mln
14.01%
jan 1, 2008
28.866 mln
+3.308 mln
12.95%
jan 1, 2009
26.777 mln
-2.089 mln
-7.24%
jan 1, 2010
29.057 mln
+2.281 mln
8.52%
jan 1, 2011
29.056 mln
-1.474K
-0.01%
jan 1, 2012
29.236 mln
+180.678K
0.62%
jan 1, 2013
31.109 mln
+1.873 mln
6.41%
jan 1, 2014
31.588 mln
+478.626K
1.54%
jan 1, 2015
31.588 mln
-0.004
0.0%
jan 1, 2016
31.588 mln
0.0
0.0%
Ranking of countries by current statistics by years


Comments: