29
/
en
AIzaSyAYiBZKx7MnpbEhh9jyipgxe19OcubqV5w
April 1, 2024
142194
Greece
GRC
true
2
1
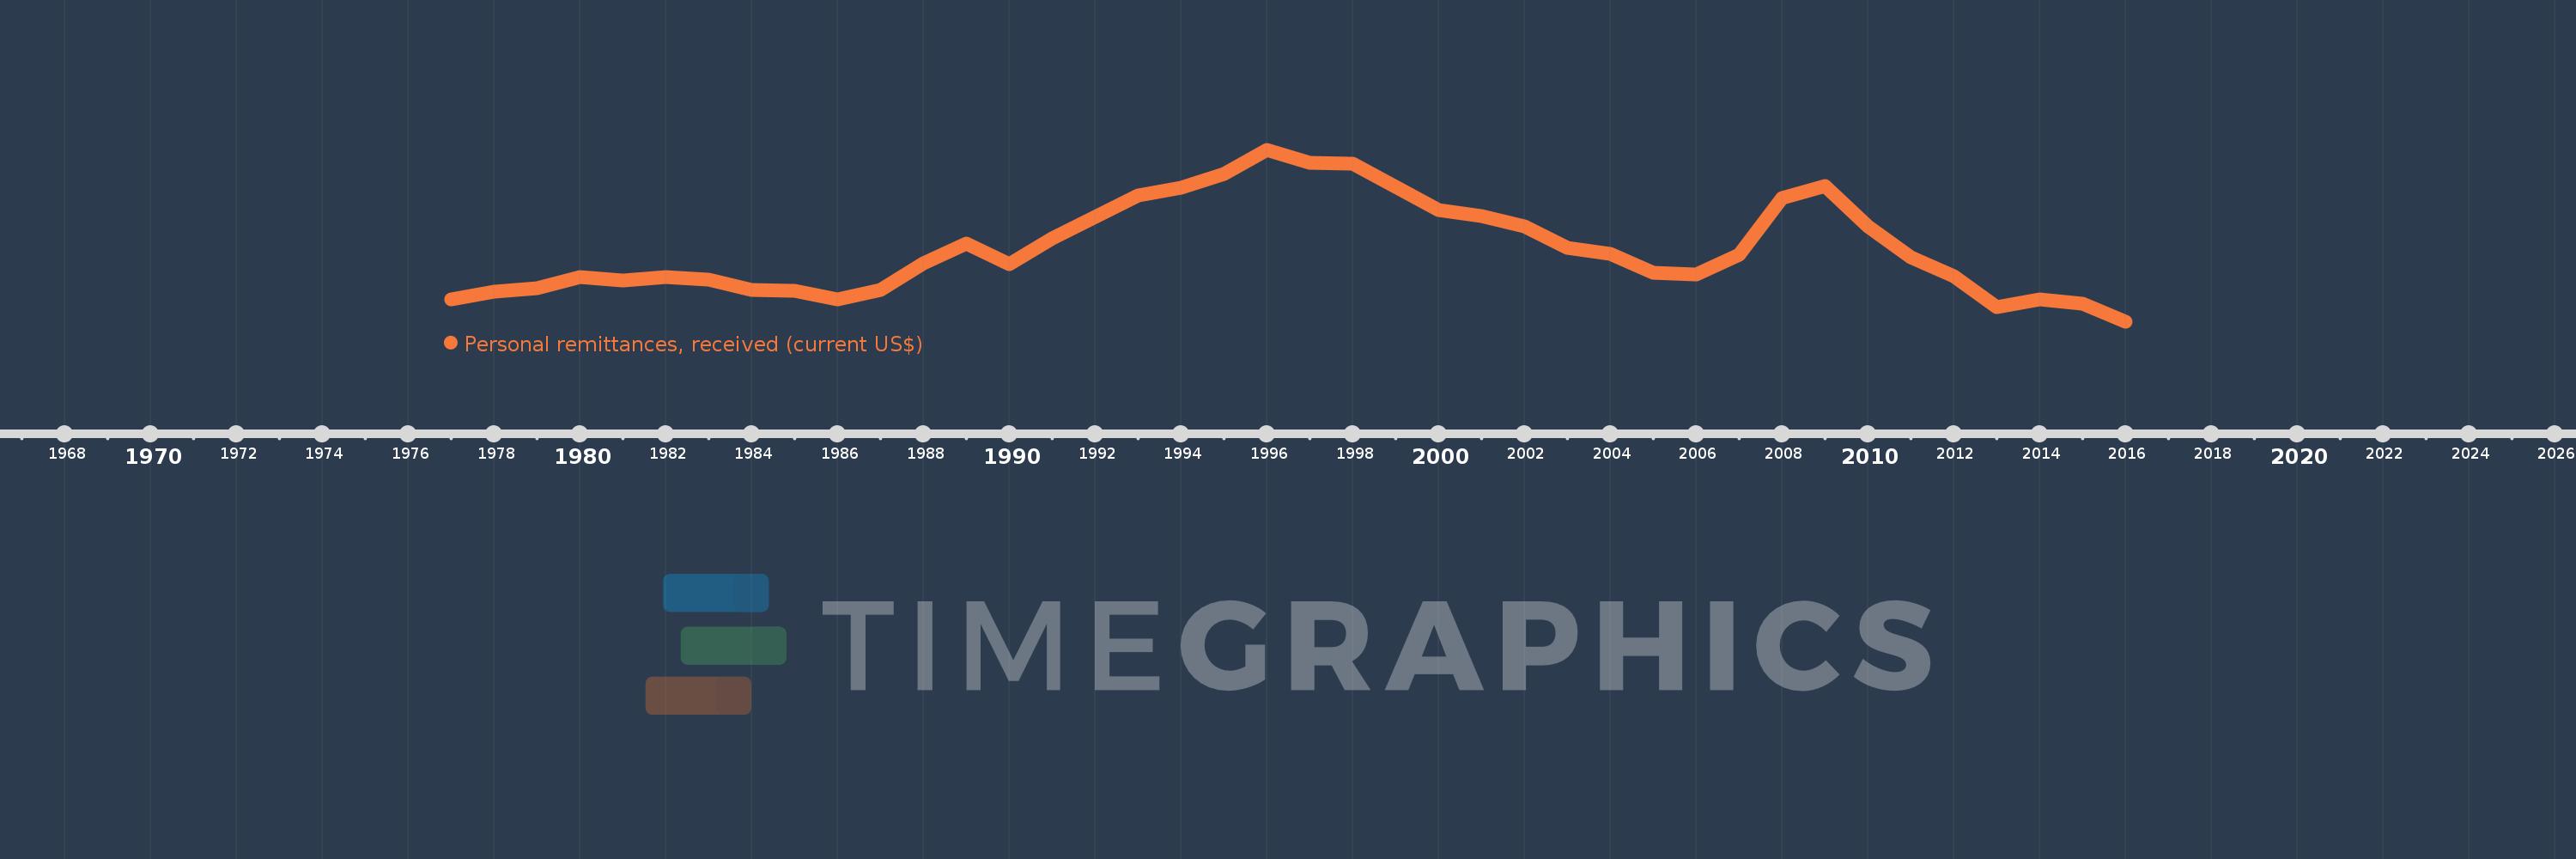
Personal remittances, received (current US$)
2016,2015,2014,2013,2012,2011,2010,2009,2008,2007,2006,2005,2004,2003,2002,2001,2000,1999,1998,1997,1996,1995,1994,1993,1992,1991,1990,1989,1988,1987,1986,1985,1984,1983,1982,1981,1980,1979,1978,1977
This statistics in other country:
AfghanistanAlbaniaAlgeriaAngolaAntigua and BarbudaArab WorldArgentinaArmeniaArubaAustraliaAustriaAzerbaijanBangladeshBarbadosBelarusBelgiumBelizeBeninBermudaBhutanBoliviaBosnia and HerzegovinaBotswanaBrazilBulgariaBurkina FasoBurundiCabo VerdeCambodiaCameroonCanadaCaribbean small statesCentral African RepublicCentral Europe and the BalticsChadChileChinaColombiaComorosCongo, Dem. Rep.Congo, Rep.Costa RicaCote d'IvoireCroatiaCuracaoCyprusCzech RepublicDenmarkDjiboutiDominicaDominican RepublicEarly-demographic dividendEast Asia & PacificEast Asia & Pacific (excluding high income)East Asia & Pacific (IDA & IBRD countries)EcuadorEgypt, Arab Rep.El SalvadorEquatorial GuineaEritreaEstoniaEthiopiaEuro areaEurope & Central AsiaEurope & Central Asia (excluding high income)Europe & Central Asia (IDA & IBRD countries)European UnionFaroe IslandsFijiFinlandFragile and conflict affected situationsFranceFrench PolynesiaGabonGambia, TheGeorgiaGermanyGhanaGreeceGrenadaGuatemalaGuineaGuinea-BissauGuyanaHaitiHeavily indebted poor countries (HIPC)High incomeHondurasHong Kong SAR, ChinaHungaryIBRD onlyIcelandIDA & IBRD totalIDA blendIDA onlyIDA totalIndiaIndonesiaIran, Islamic Rep.IraqIrelandIsraelItalyJamaicaJapanJordanKazakhstanKenyaKiribatiKorea, Rep.KosovoKuwaitKyrgyz RepublicLao PDRLate-demographic dividendLatin America & Caribbean Latin America & Caribbean (excluding high income)Latin America & the Caribbean (IDA & IBRD countries)LatviaLeast developed countries: UN classificationLebanonLesothoLiberiaLibyaLithuaniaLow & middle incomeLow incomeLower middle incomeLuxembourgMacao SAR, ChinaMacedonia, FYRMadagascarMalawiMalaysiaMaldivesMaliMaltaMarshall IslandsMauritaniaMauritiusMexicoMicronesia, Fed. Sts.Middle East & North AfricaMiddle East & North Africa (excluding high income)Middle East & North Africa (IDA & IBRD countries)Middle incomeMoldovaMongoliaMontenegroMoroccoMozambiqueMyanmarNamibiaNepalNetherlandsNew CaledoniaNew ZealandNicaraguaNigerNigeriaNorth AmericaNorwayOECD membersOmanOther small statesPacific island small statesPakistanPalauPanamaPapua New GuineaParaguayPeruPhilippinesPolandPortugalPost-demographic dividendPre-demographic dividendQatarRomaniaRussian FederationRwandaSamoaSao Tome and PrincipeSaudi ArabiaSenegalSerbiaSeychellesSierra LeoneSint Maarten (Dutch part)Slovak RepublicSloveniaSmall statesSolomon IslandsSomaliaSouth AfricaSouth AsiaSouth Asia (IDA & IBRD)South SudanSpainSri LankaSt. Kitts and NevisSt. LuciaSt. Vincent and the GrenadinesSub-Saharan Africa Sub-Saharan Africa (excluding high income)Sub-Saharan Africa (IDA & IBRD countries)SudanSurinameSwazilandSwedenSwitzerlandSyrian Arab RepublicTajikistanTanzaniaThailandTimor-LesteTogoTongaTrinidad and TobagoTunisiaTurkeyTurkmenistanTuvaluUgandaUkraineUnited KingdomUnited StatesUpper middle incomeUruguayUzbekistanVanuatuVenezuela, RBVietnamWest Bank and GazaWorldYemen, Rep.ZambiaZimbabwe Timeline:
This timeline shows a graph from 1977 to 2016 of Greece. No data until 1976. Number of actual observations by date: 40.
Source name:
World Development Indicators
Source organization:
World Bank staff estimates based on IMF balance of payments data.
Categories, topics:
Economy & Growth, Financial Sector, External Debt
Last updated:
apr 23, 2017
Indicators value changes by year
Minimum:
428.809 mln
jan 1, 2016
Maximum:
3.286 bln
jan 1, 1996
At the date of observation
Value
Absolute change
Change from previous value
jan 1, 1977
805.0 mln
+805.0 mln
0.0%
jan 1, 1978
940.0 mln
+135.0 mln
16.77%
jan 1, 1979
989.0 mln
+49.0 mln
5.21%
jan 1, 1980
1.181 bln
+192.0 mln
19.41%
jan 1, 1981
1.119 bln
-62.0 mln
-5.25%
jan 1, 1982
1.169 bln
+50.0 mln
4.47%
jan 1, 1983
1.14 bln
-29.0 mln
-2.48%
jan 1, 1984
964.0 mln
-176.0 mln
-15.44%
jan 1, 1985
945.0 mln
-19.0 mln
-1.97%
jan 1, 1986
807.0 mln
-138.0 mln
-14.6%
jan 1, 1987
967.0 mln
+160.0 mln
19.83%
jan 1, 1988
1.407 bln
+440.0 mln
45.5%
jan 1, 1989
1.737 bln
+330.0 mln
23.45%
jan 1, 1990
1.387 bln
-350.0 mln
-20.15%
jan 1, 1991
1.817 bln
+430.0 mln
31.0%
jan 1, 1992
2.173 bln
+356.0 mln
19.59%
jan 1, 1993
2.531 bln
+358.0 mln
16.47%
jan 1, 1994
2.655 bln
+124.0 mln
4.9%
jan 1, 1995
2.886 bln
+231.0 mln
8.7%
jan 1, 1996
3.286 bln
+400.0 mln
13.86%
jan 1, 1997
3.079 bln
-207.0 mln
-6.3%
jan 1, 1998
3.062 bln
-17.0 mln
-0.55%
jan 1, 1999
2.673 bln
-388.95 mln
-12.7%
jan 1, 2000
2.284 bln
-388.95 mln
-14.55%
jan 1, 2001
2.194 bln
-90.3 mln
-3.95%
jan 1, 2002
2.014 bln
-179.8 mln
-8.2%
jan 1, 2003
1.659 bln
-355.067 mln
-17.63%
jan 1, 2004
1.564 bln
-95.139 mln
-5.73%
jan 1, 2005
1.242 bln
-321.896 mln
-20.58%
jan 1, 2006
1.22 bln
-21.791 mln
-1.75%
jan 1, 2007
1.543 bln
+322.516 mln
26.43%
jan 1, 2008
2.484 bln
+941.098 mln
61.01%
jan 1, 2009
2.687 bln
+202.914 mln
8.17%
jan 1, 2010
2.02 bln
-666.311 mln
-24.8%
jan 1, 2011
1.499 bln
-521.121 mln
-25.79%
jan 1, 2012
1.186 bln
-313.01 mln
-20.88%
jan 1, 2013
681.227 mln
-504.967 mln
-42.57%
jan 1, 2014
804.752 mln
+123.525 mln
18.13%
jan 1, 2015
734.712 mln
-70.04 mln
-8.7%
jan 1, 2016
428.809 mln
-305.902 mln
-41.64%
Ranking of countries by current statistics by years


Comments: