29
/
en
AIzaSyAYiBZKx7MnpbEhh9jyipgxe19OcubqV5w
April 1, 2024
209668
New Zealand
NZL
true
2
1
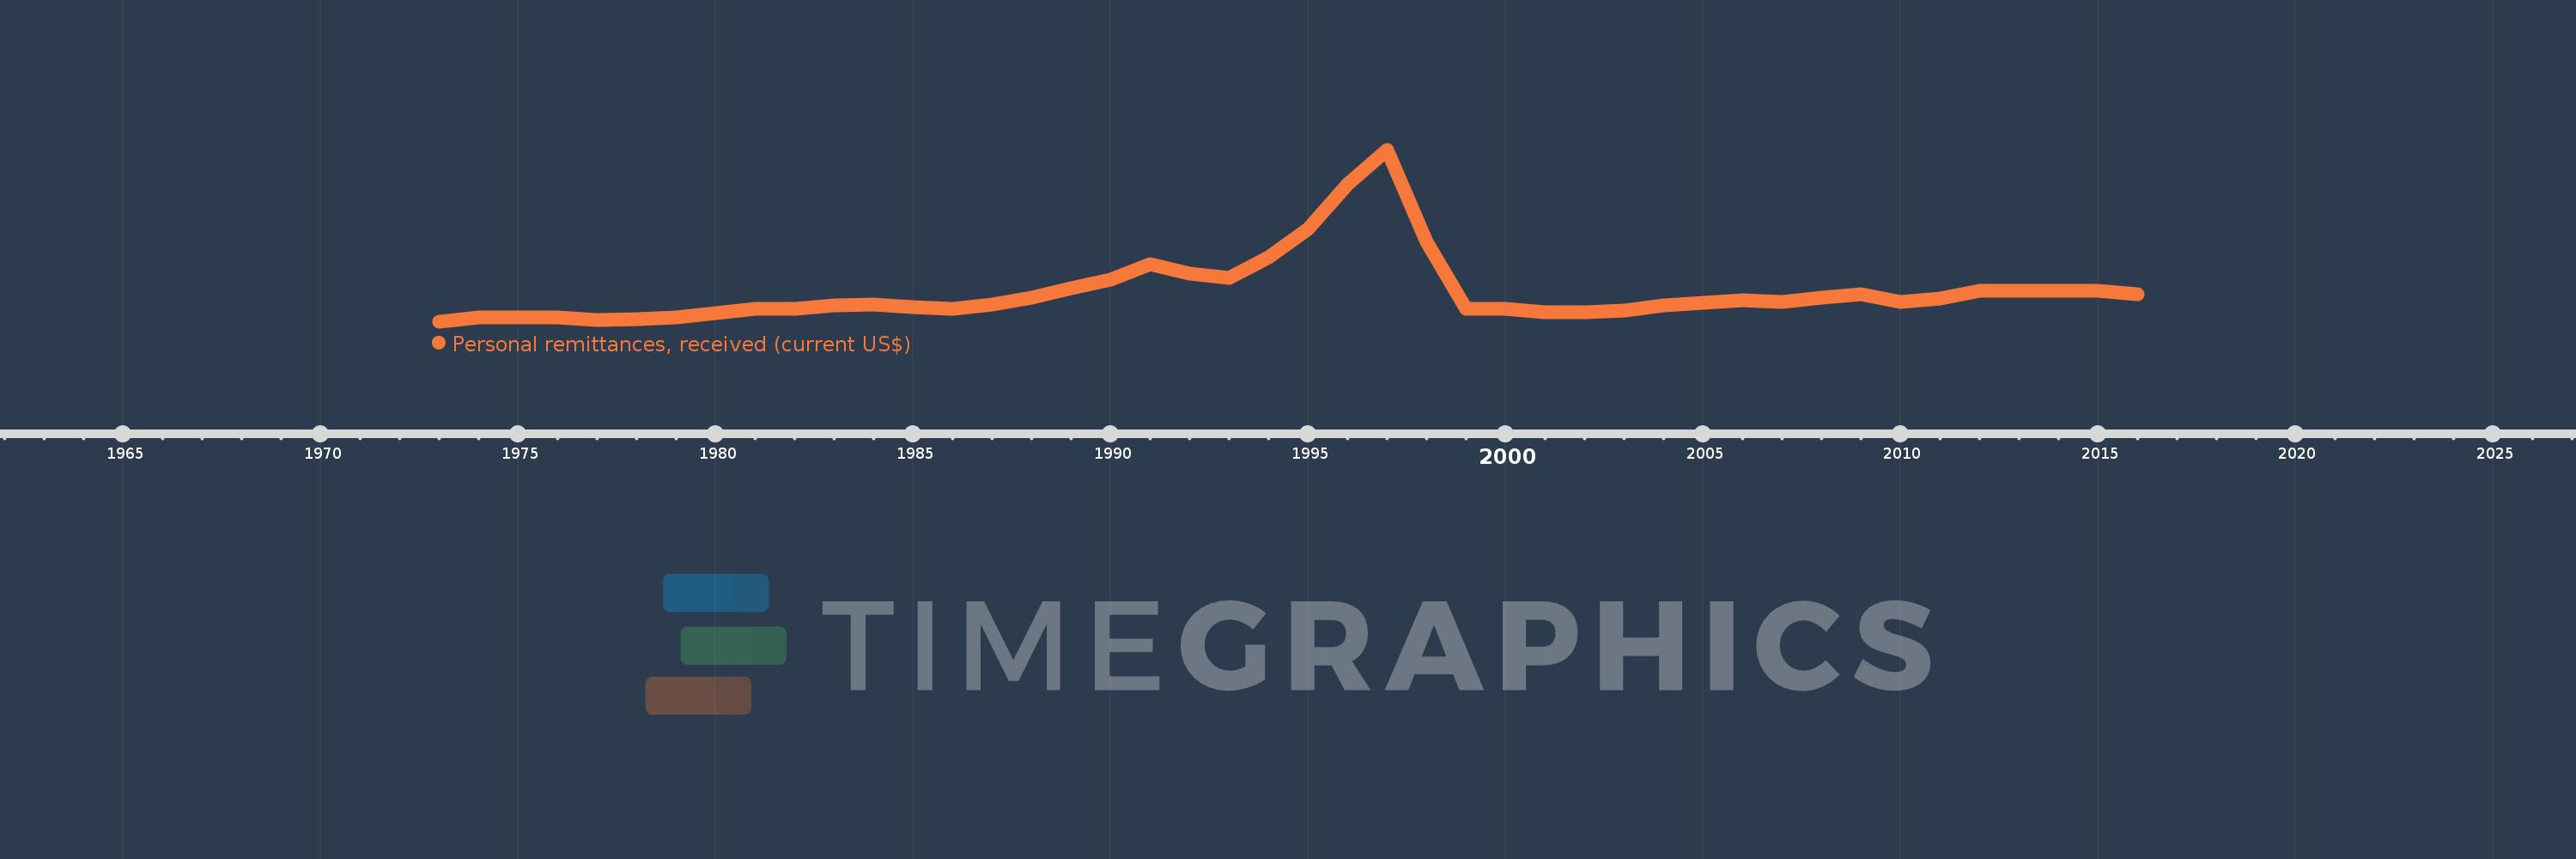
Personal remittances, received (current US$)
2016,2015,2014,2013,2012,2011,2010,2009,2008,2007,2006,2005,2004,2003,2002,2001,2000,1999,1998,1997,1996,1995,1994,1993,1992,1991,1990,1989,1988,1987,1986,1985,1984,1983,1982,1981,1980,1979,1978,1977,1976,1975,1974,1973
This statistics in other country:
AfghanistanAlbaniaAlgeriaAngolaAntigua and BarbudaArab WorldArgentinaArmeniaArubaAustraliaAustriaAzerbaijanBangladeshBarbadosBelarusBelgiumBelizeBeninBermudaBhutanBoliviaBosnia and HerzegovinaBotswanaBrazilBulgariaBurkina FasoBurundiCabo VerdeCambodiaCameroonCanadaCaribbean small statesCentral African RepublicCentral Europe and the BalticsChadChileChinaColombiaComorosCongo, Dem. Rep.Congo, Rep.Costa RicaCote d'IvoireCroatiaCuracaoCyprusCzech RepublicDenmarkDjiboutiDominicaDominican RepublicEarly-demographic dividendEast Asia & PacificEast Asia & Pacific (excluding high income)East Asia & Pacific (IDA & IBRD countries)EcuadorEgypt, Arab Rep.El SalvadorEquatorial GuineaEritreaEstoniaEthiopiaEuro areaEurope & Central AsiaEurope & Central Asia (excluding high income)Europe & Central Asia (IDA & IBRD countries)European UnionFaroe IslandsFijiFinlandFragile and conflict affected situationsFranceFrench PolynesiaGabonGambia, TheGeorgiaGermanyGhanaGreeceGrenadaGuatemalaGuineaGuinea-BissauGuyanaHaitiHeavily indebted poor countries (HIPC)High incomeHondurasHong Kong SAR, ChinaHungaryIBRD onlyIcelandIDA & IBRD totalIDA blendIDA onlyIDA totalIndiaIndonesiaIran, Islamic Rep.IraqIrelandIsraelItalyJamaicaJapanJordanKazakhstanKenyaKiribatiKorea, Rep.KosovoKuwaitKyrgyz RepublicLao PDRLate-demographic dividendLatin America & Caribbean Latin America & Caribbean (excluding high income)Latin America & the Caribbean (IDA & IBRD countries)LatviaLeast developed countries: UN classificationLebanonLesothoLiberiaLibyaLithuaniaLow & middle incomeLow incomeLower middle incomeLuxembourgMacao SAR, ChinaMacedonia, FYRMadagascarMalawiMalaysiaMaldivesMaliMaltaMarshall IslandsMauritaniaMauritiusMexicoMicronesia, Fed. Sts.Middle East & North AfricaMiddle East & North Africa (excluding high income)Middle East & North Africa (IDA & IBRD countries)Middle incomeMoldovaMongoliaMontenegroMoroccoMozambiqueMyanmarNamibiaNepalNetherlandsNew CaledoniaNew ZealandNicaraguaNigerNigeriaNorth AmericaNorwayOECD membersOmanOther small statesPacific island small statesPakistanPalauPanamaPapua New GuineaParaguayPeruPhilippinesPolandPortugalPost-demographic dividendPre-demographic dividendQatarRomaniaRussian FederationRwandaSamoaSao Tome and PrincipeSaudi ArabiaSenegalSerbiaSeychellesSierra LeoneSint Maarten (Dutch part)Slovak RepublicSloveniaSmall statesSolomon IslandsSomaliaSouth AfricaSouth AsiaSouth Asia (IDA & IBRD)South SudanSpainSri LankaSt. Kitts and NevisSt. LuciaSt. Vincent and the GrenadinesSub-Saharan Africa Sub-Saharan Africa (excluding high income)Sub-Saharan Africa (IDA & IBRD countries)SudanSurinameSwazilandSwedenSwitzerlandSyrian Arab RepublicTajikistanTanzaniaThailandTimor-LesteTogoTongaTrinidad and TobagoTunisiaTurkeyTurkmenistanTuvaluUgandaUkraineUnited KingdomUnited StatesUpper middle incomeUruguayUzbekistanVanuatuVenezuela, RBVietnamWest Bank and GazaWorldYemen, Rep.ZambiaZimbabwe Timeline:
This timeline shows a graph from 1973 to 2016 of New Zealand. No data until 1972. Number of actual observations by date: 44.
Source name:
World Development Indicators
Source organization:
World Bank staff estimates based on IMF balance of payments data.
Categories, topics:
Economy & Growth, Financial Sector, External Debt
Last updated:
apr 23, 2017
Indicators value changes by year
Minimum:
107.568 mln
jan 1, 1973
Maximum:
2.04 bln
jan 1, 1997
At the date of observation
Value
Absolute change
Change from previous value
jan 1, 1973
107.568 mln
+107.568 mln
0.0%
jan 1, 1974
156.078 mln
+48.51 mln
45.1%
jan 1, 1975
162.146 mln
+6.069 mln
3.89%
jan 1, 1976
157.394 mln
-4.753 mln
-2.93%
jan 1, 1977
127.377 mln
-30.017 mln
-19.07%
jan 1, 1978
143.646 mln
+16.269 mln
12.77%
jan 1, 1979
155.533 mln
+11.887 mln
8.28%
jan 1, 1980
207.46 mln
+51.927 mln
33.39%
jan 1, 1981
256.153 mln
+48.693 mln
23.47%
jan 1, 1982
259.673 mln
+3.521 mln
1.37%
jan 1, 1983
294.577 mln
+34.904 mln
13.44%
jan 1, 1984
300.759 mln
+6.182 mln
2.1%
jan 1, 1985
275.289 mln
-25.47 mln
-8.47%
jan 1, 1986
256.343 mln
-18.946 mln
-6.88%
jan 1, 1987
303.651 mln
+47.308 mln
18.46%
jan 1, 1988
379.272 mln
+75.62 mln
24.9%
jan 1, 1989
491.96 mln
+112.688 mln
29.71%
jan 1, 1990
584.966 mln
+93.006 mln
18.91%
jan 1, 1991
761.848 mln
+176.882 mln
30.24%
jan 1, 1992
651.125 mln
-110.722 mln
-14.53%
jan 1, 1993
602.392 mln
-48.733 mln
-7.48%
jan 1, 1994
832.968 mln
+230.576 mln
38.28%
jan 1, 1995
1.155 bln
+321.804 mln
38.63%
jan 1, 1996
1.652 bln
+496.858 mln
43.03%
jan 1, 1997
2.04 bln
+388.15 mln
23.5%
jan 1, 1998
1.01 bln
-1.029 bln
-50.47%
jan 1, 1999
259.446 mln
-750.895 mln
-74.32%
jan 1, 2000
257.531 mln
-1.915 mln
-0.74%
jan 1, 2001
215.3 mln
-42.23 mln
-16.4%
jan 1, 2002
218.798 mln
+3.498 mln
1.62%
jan 1, 2003
232.522 mln
+13.724 mln
6.27%
jan 1, 2004
290.416 mln
+57.894 mln
24.9%
jan 1, 2005
322.273 mln
+31.857 mln
10.97%
jan 1, 2006
352.036 mln
+29.763 mln
9.24%
jan 1, 2007
334.684 mln
-17.352 mln
-4.93%
jan 1, 2008
383.653 mln
+48.969 mln
14.63%
jan 1, 2009
421.363 mln
+37.71 mln
9.83%
jan 1, 2010
331.041 mln
-90.322 mln
-21.44%
jan 1, 2011
370.503 mln
+39.462 mln
11.92%
jan 1, 2012
455.316 mln
+84.813 mln
22.89%
jan 1, 2013
461.783 mln
+6.466 mln
1.42%
jan 1, 2014
459.239 mln
-2.543 mln
-0.55%
jan 1, 2015
462.27 mln
+3.031 mln
0.66%
jan 1, 2016
420.526 mln
-41.744 mln
-9.03%
Ranking of countries by current statistics by years


Comments: