29
/
en
AIzaSyAYiBZKx7MnpbEhh9jyipgxe19OcubqV5w
April 1, 2024
267143
Trinidad and Tobago
TTO
true
2
1
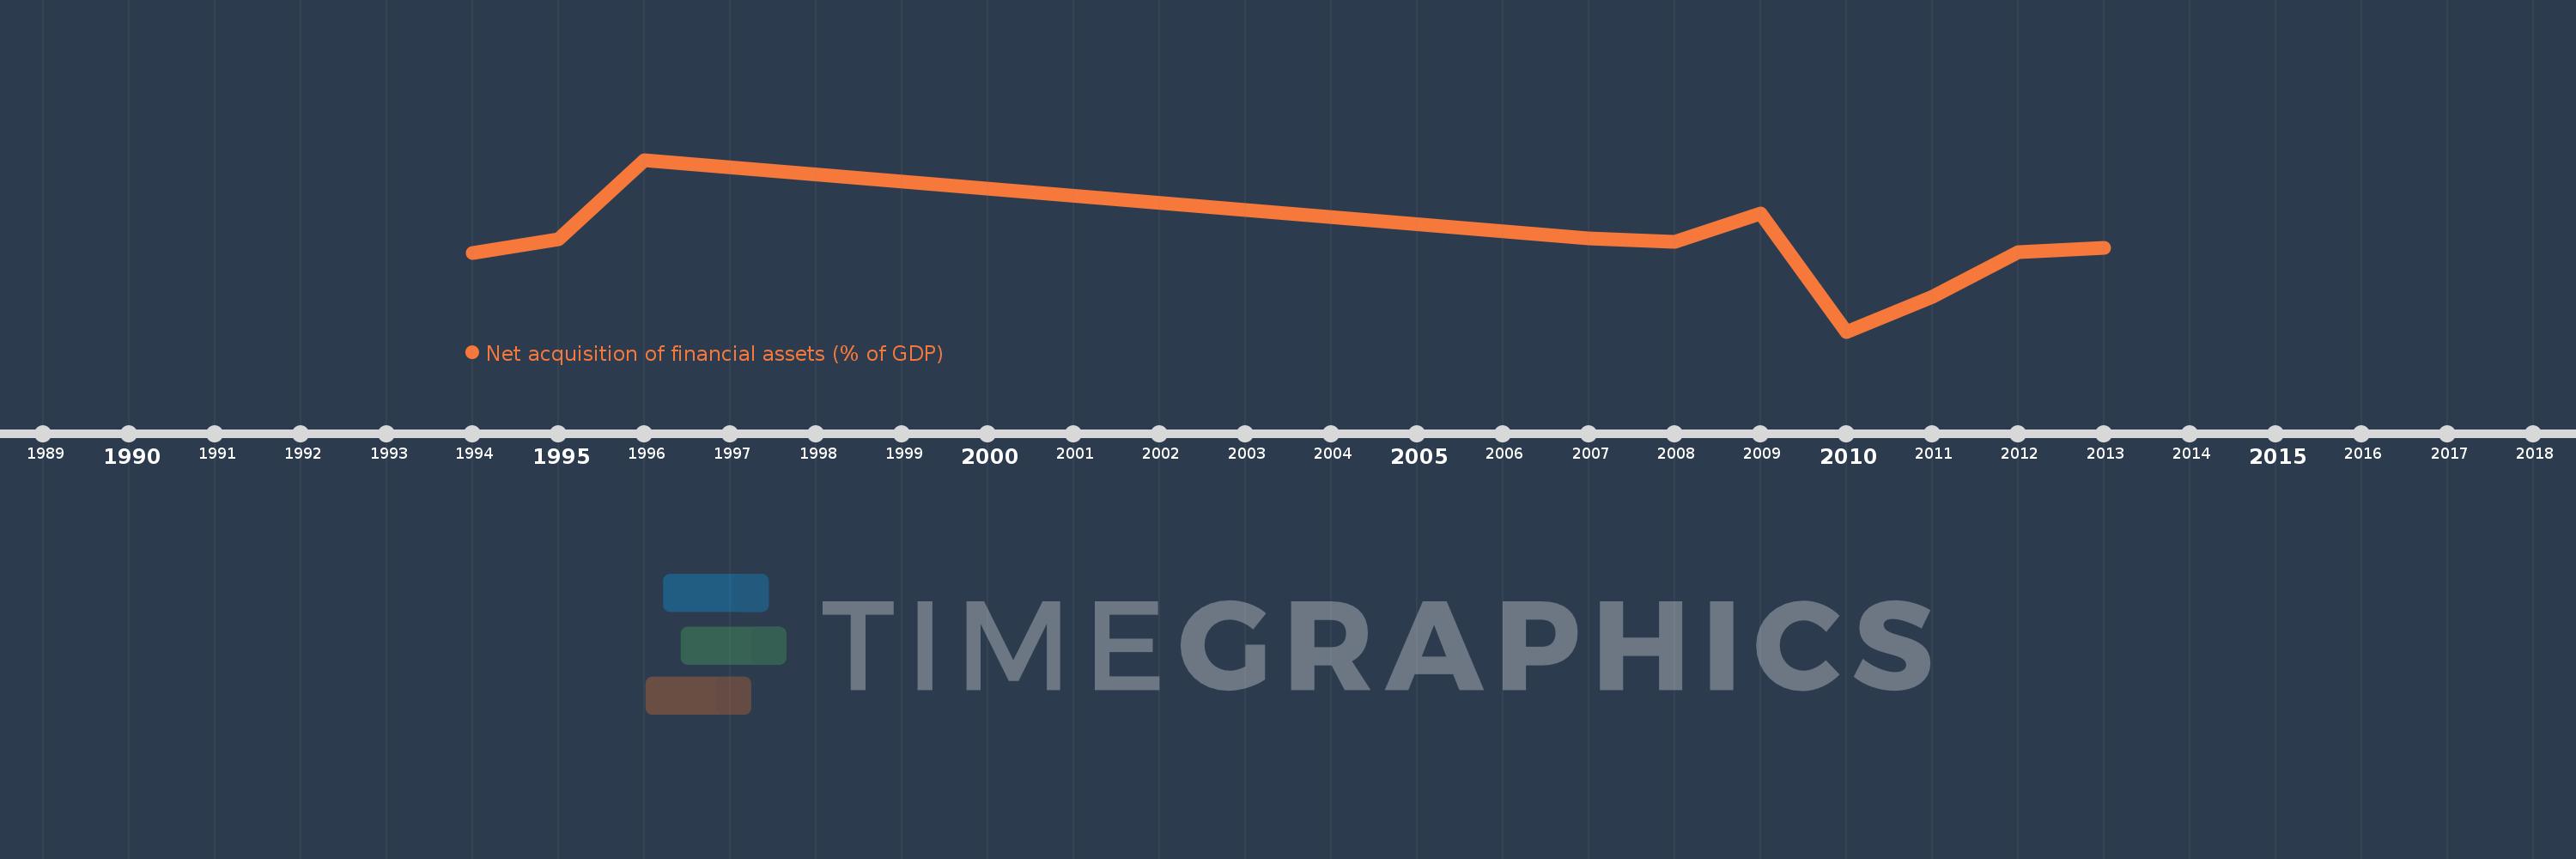
Net acquisition of financial assets (% of GDP)
2013,2012,2011,2010,2009,2008,2007,1996,1995,1994
This statistics in other country:
Timeline:
This timeline shows a graph from 1994 to 2013 of Trinidad and Tobago. No data until 1993. Number of actual observations by date: 10.
Source name:
World Development Indicators
Source organization:
International Monetary Fund, Government Finance Statistics Yearbook and data files.
Categories, topics:
Public Sector
Last updated:
apr 23, 2017
Indicators value changes by year
Minimum:
-5.103
jan 1, 2010
At the date of observation
Value
Absolute change
Change from previous value
jan 1, 1994
-0.308
-0.308
0.0%
jan 1, 1995
0.517
+0.826
-267.72%
jan 1, 1996
5.332
+4.815
930.88%
jan 1, 2007
0.572
-4.759
-89.26%
jan 1, 2008
0.355
-0.217
-37.91%
jan 1, 2009
2.074
+1.718
483.36%
jan 1, 2010
-5.103
-7.177
-346.11%
jan 1, 2011
-2.984
+2.119
-41.52%
jan 1, 2012
-0.292
+2.692
-90.21%
jan 1, 2013
-0.019
+0.273
-93.37%
Ranking of countries by current statistics by years


Comments: