29
/
en
AIzaSyAYiBZKx7MnpbEhh9jyipgxe19OcubqV5w
April 1, 2024
152827
Hungary
HUN
true
2
1
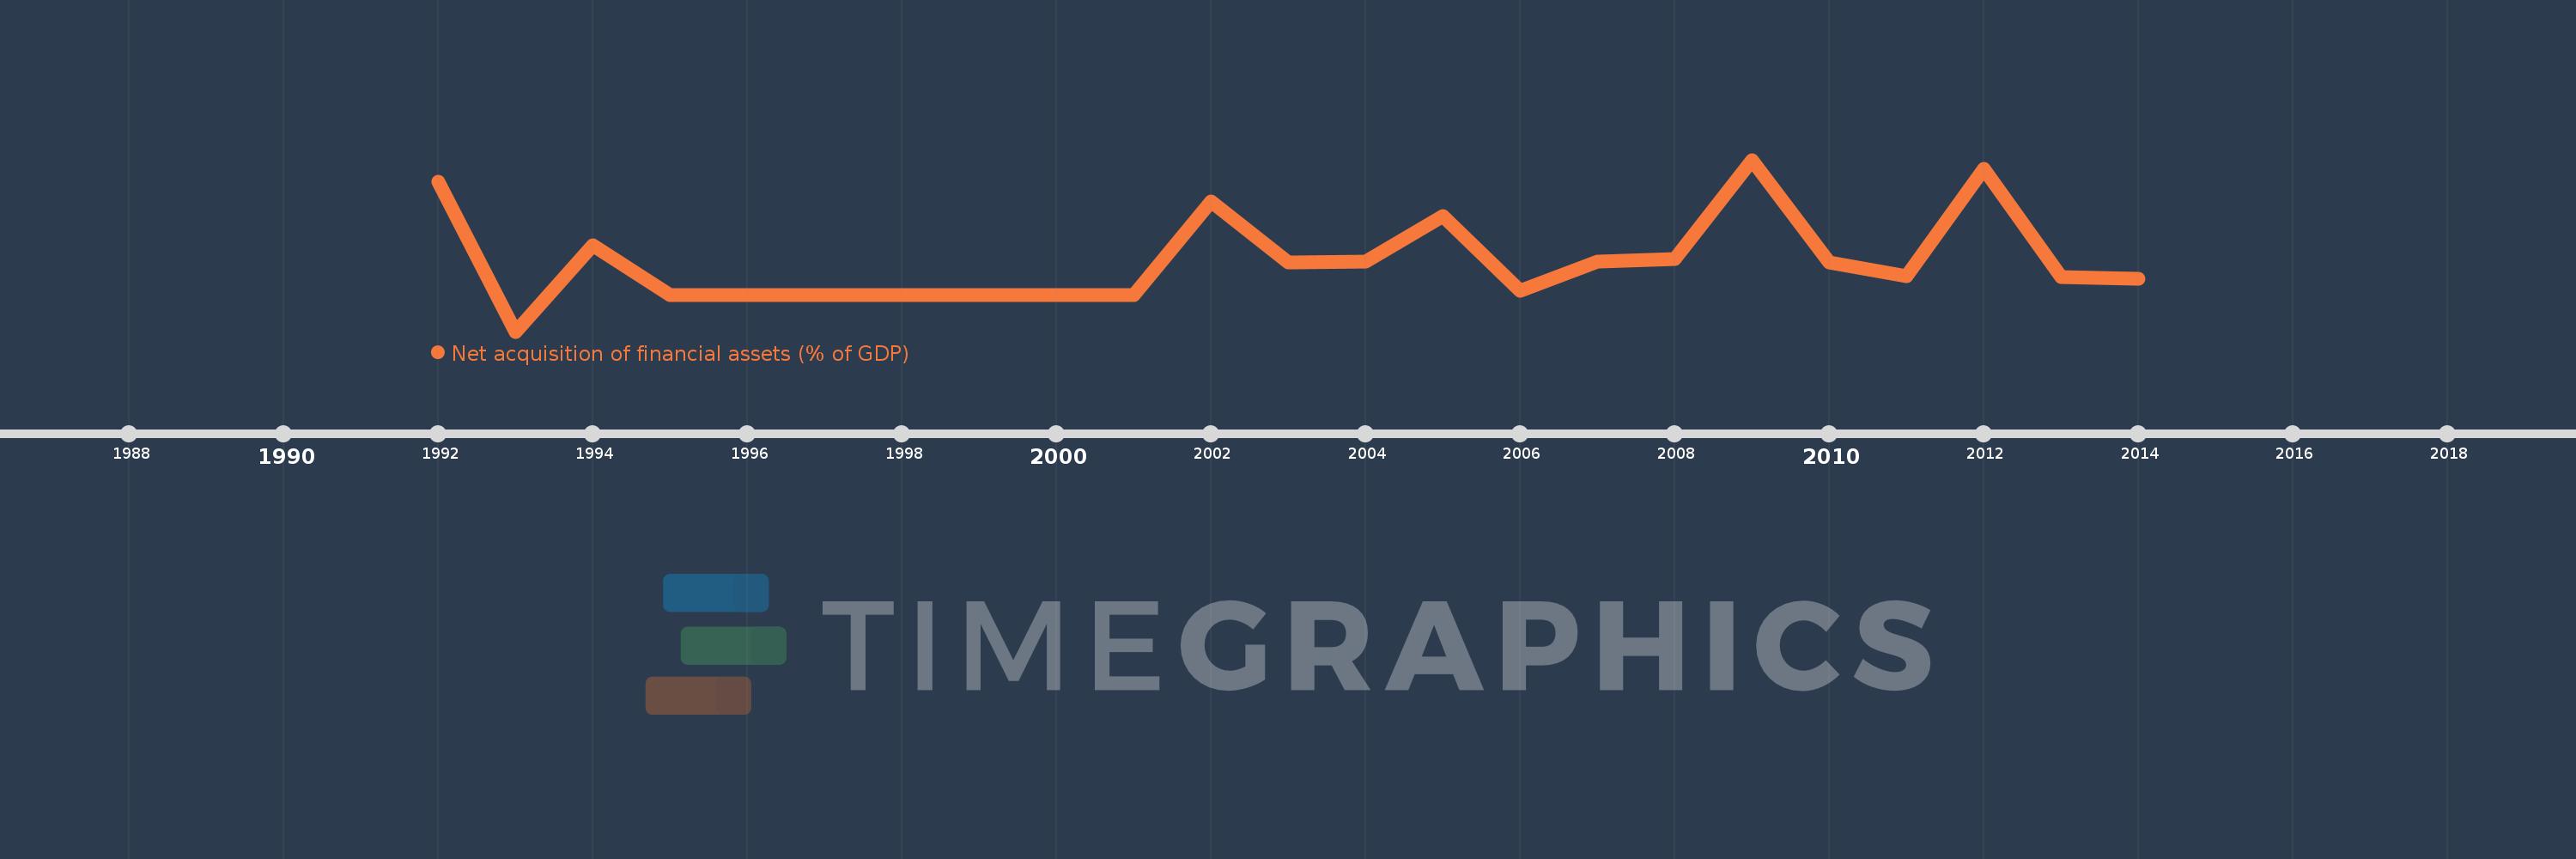
Net acquisition of financial assets (% of GDP)
2014,2013,2012,2011,2010,2009,2008,2007,2006,2005,2004,2003,2002,2001,1995,1994,1993,1992
This statistics in other country:
Timeline:
This timeline shows a graph from 1992 to 2014 of Hungary. No data until 1991. Number of actual observations by date: 18.
Source name:
World Development Indicators
Source organization:
International Monetary Fund, Government Finance Statistics Yearbook and data files.
Categories, topics:
Public Sector
Last updated:
apr 23, 2017
Indicators value changes by year
Minimum:
-3.977
jan 1, 1993
At the date of observation
Value
Absolute change
Change from previous value
jan 1, 1992
3.452
+3.452
0.0%
jan 1, 1993
-3.977
-7.429
-215.19%
jan 1, 1994
0.299
+4.276
-107.52%
jan 1, 1995
-2.155
-2.454
-820.55%
jan 1, 2001
-2.163
-0.008
0.37%
jan 1, 2002
2.483
+4.646
-214.81%
jan 1, 2003
-0.528
-3.012
-121.28%
jan 1, 2004
-0.48
+0.049
-9.2%
jan 1, 2005
1.779
+2.259
-470.73%
jan 1, 2006
-1.959
-3.738
-210.14%
jan 1, 2007
-0.514
+1.446
-73.79%
jan 1, 2008
-0.39
+0.124
-24.1%
jan 1, 2009
4.56
+4.95
-1.27K%
jan 1, 2010
-0.522
-5.082
-111.45%
jan 1, 2011
-1.243
-0.721
138.07%
jan 1, 2012
4.119
+5.362
-431.43%
jan 1, 2013
-1.255
-5.374
-130.46%
jan 1, 2014
-1.343
-0.089
7.06%
Ranking of countries by current statistics by years


Comments: