29
/
en
AIzaSyAYiBZKx7MnpbEhh9jyipgxe19OcubqV5w
April 1, 2024
109981
Congo, Dem. Rep.
COD
true
2
1
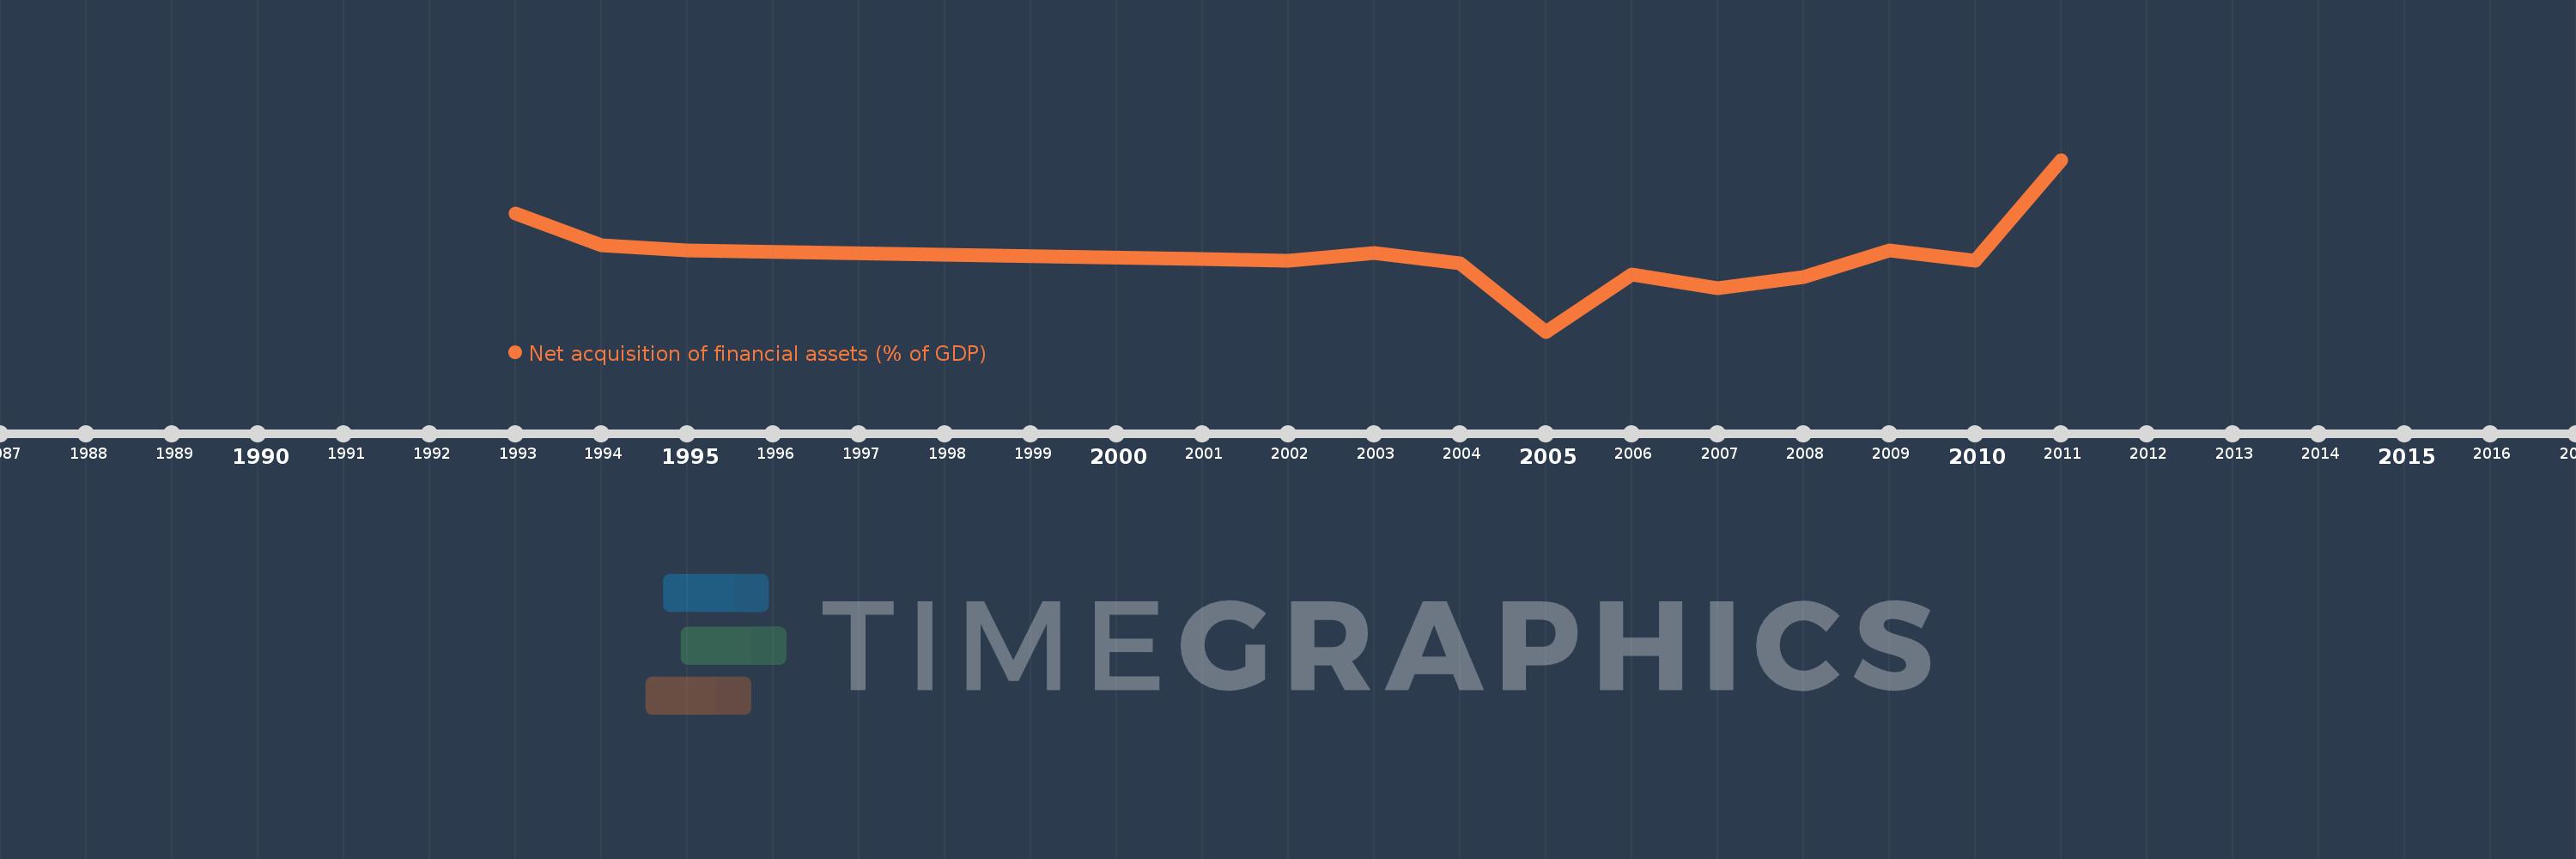
Net acquisition of financial assets (% of GDP)
2011,2010,2009,2008,2007,2006,2005,2004,2003,2002,2001,1995,1994,1993
This statistics in other country:
Timeline:
This timeline shows a graph from 1993 to 2011 of Congo, Dem. Rep.. No data until 1992. Number of actual observations by date: 14.
Source name:
World Development Indicators
Source organization:
International Monetary Fund, Government Finance Statistics Yearbook and data files.
Categories, topics:
Public Sector
Last updated:
apr 23, 2017
Indicators value changes by year
Minimum:
-2.199
jan 1, 2005
At the date of observation
Value
Absolute change
Change from previous value
jan 1, 1993
1.359
+1.359
0.0%
jan 1, 1994
0.405
-0.955
-70.22%
jan 1, 1995
0.242
-0.163
-40.29%
jan 1, 2001
-0.021
-0.262
-108.58%
jan 1, 2002
-0.056
-0.035
169.63%
jan 1, 2003
0.153
+0.209
-373.24%
jan 1, 2004
-0.14
-0.293
-191.8%
jan 1, 2005
-2.199
-2.059
1.47K%
jan 1, 2006
-0.485
+1.714
-77.96%
jan 1, 2007
-0.907
-0.422
87.05%
jan 1, 2008
-0.557
+0.35
-38.61%
jan 1, 2009
0.247
+0.803
-144.3%
jan 1, 2010
-0.057
-0.304
-123.31%
jan 1, 2011
2.966
+3.023
-5.26K%
Ranking of countries by current statistics by years


Comments: