29
/
en
AIzaSyAYiBZKx7MnpbEhh9jyipgxe19OcubqV5w
April 1, 2024
101374
Canada
CAN
true
2
1
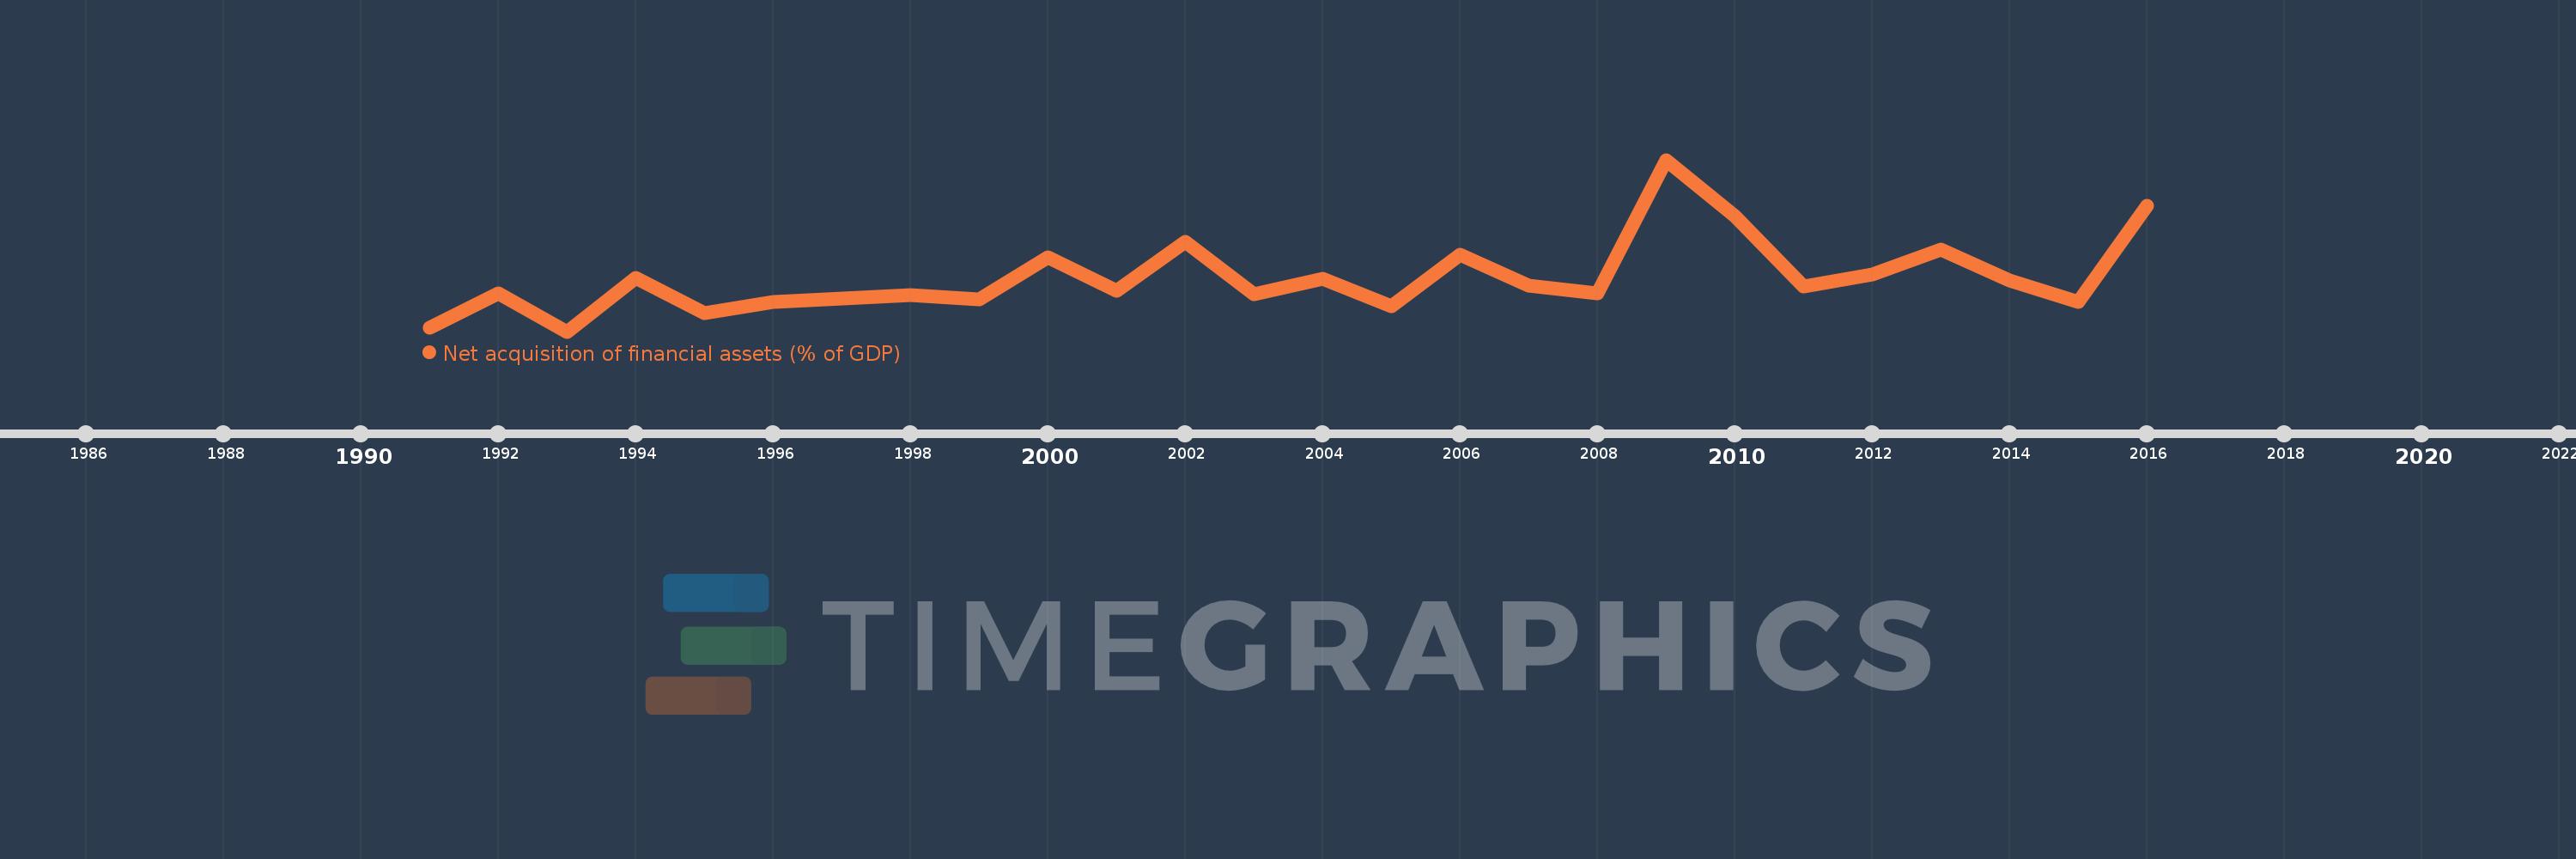
Net acquisition of financial assets (% of GDP)
2016,2015,2014,2013,2012,2011,2010,2009,2008,2007,2006,2005,2004,2003,2002,2001,2000,1999,1998,1997,1996,1995,1994,1993,1992,1991
This statistics in other country:
Timeline:
This timeline shows a graph from 1991 to 2016 of Canada. No data until 1990. Number of actual observations by date: 26.
Source name:
World Development Indicators
Source organization:
International Monetary Fund, Government Finance Statistics Yearbook and data files.
Categories, topics:
Public Sector
Last updated:
apr 23, 2017
Indicators value changes by year
Minimum:
-0.977
jan 1, 1993
At the date of observation
Value
Absolute change
Change from previous value
jan 1, 1991
-0.79
-0.79
0.0%
jan 1, 1992
0.681
+1.471
-186.17%
jan 1, 1993
-0.977
-1.658
-243.48%
jan 1, 1994
1.358
+2.335
-239.05%
jan 1, 1995
-0.159
-1.518
-111.72%
jan 1, 1996
0.299
+0.458
-287.9%
jan 1, 1997
0.472
+0.172
57.65%
jan 1, 1998
0.61
+0.138
29.3%
jan 1, 1999
0.431
-0.179
-29.32%
jan 1, 2000
2.276
+1.845
428.15%
jan 1, 2001
0.795
-1.481
-65.07%
jan 1, 2002
2.951
+2.155
271.05%
jan 1, 2003
0.666
-2.285
-77.43%
jan 1, 2004
1.343
+0.677
101.71%
jan 1, 2005
0.143
-1.2
-89.34%
jan 1, 2006
2.391
+2.248
1.57K%
jan 1, 2007
1.014
-1.377
-57.59%
jan 1, 2008
0.7
-0.315
-31.02%
jan 1, 2009
6.522
+5.822
832.23%
jan 1, 2010
4.053
-2.468
-37.85%
jan 1, 2011
0.973
-3.081
-76.0%
jan 1, 2012
1.526
+0.553
56.86%
jan 1, 2013
2.603
+1.077
70.62%
jan 1, 2014
1.267
-1.336
-51.34%
jan 1, 2015
0.3
-0.967
-76.34%
jan 1, 2016
4.516
+4.216
1.41K%
Ranking of countries by current statistics by years


Comments: