29
/
en
AIzaSyAYiBZKx7MnpbEhh9jyipgxe19OcubqV5w
April 1, 2024
276931
United States
USA
true
2
1
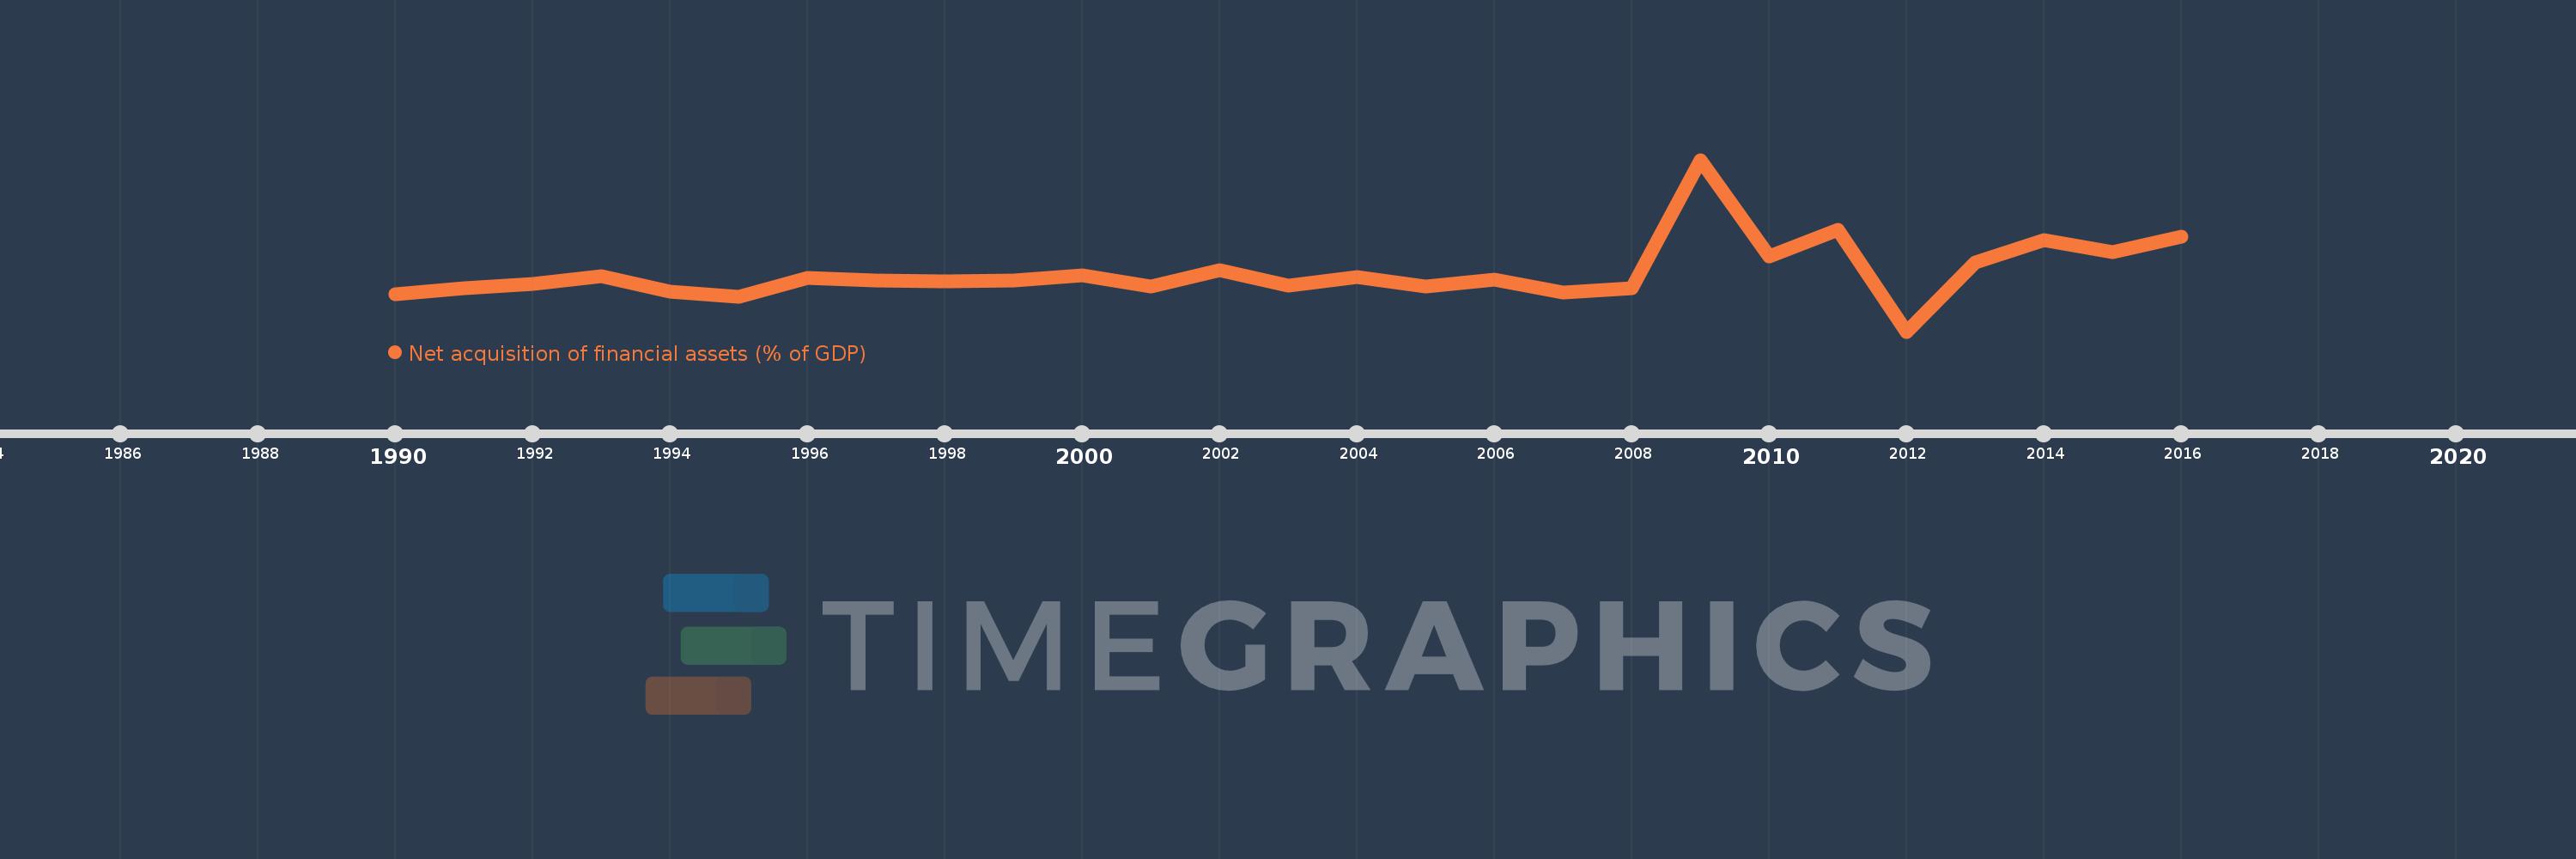
Net acquisition of financial assets (% of GDP)
2016,2015,2014,2013,2012,2011,2010,2009,2008,2007,2006,2005,2004,2003,2002,2001,2000,1999,1998,1997,1996,1995,1994,1993,1992,1991,1990
This statistics in other country:
Timeline:
This timeline shows a graph from 1990 to 2016 of United States. No data until 1989. Number of actual observations by date: 27.
Source name:
World Development Indicators
Source organization:
International Monetary Fund, Government Finance Statistics Yearbook and data files.
Categories, topics:
Public Sector
Last updated:
apr 23, 2017
Indicators value changes by year
Minimum:
-1.165
jan 1, 2012
At the date of observation
Value
Absolute change
Change from previous value
jan 1, 1990
-0.148
-0.148
0.0%
jan 1, 1991
0.018
+0.166
-111.94%
jan 1, 1992
0.118
+0.1
565.16%
jan 1, 1993
0.325
+0.207
175.85%
jan 1, 1994
-0.081
-0.407
-125.03%
jan 1, 1995
-0.234
-0.152
187.05%
jan 1, 1996
0.276
+0.51
-218.2%
jan 1, 1997
0.209
-0.067
-24.33%
jan 1, 1998
0.204
-0.005
-2.29%
jan 1, 1999
0.22
+0.016
7.75%
jan 1, 2000
0.36
+0.14
63.71%
jan 1, 2001
0.044
-0.316
-87.72%
jan 1, 2002
0.501
+0.457
1.03K%
jan 1, 2003
0.077
-0.425
-84.72%
jan 1, 2004
0.305
+0.229
298.28%
jan 1, 2005
0.043
-0.262
-85.96%
jan 1, 2006
0.235
+0.192
448.3%
jan 1, 2007
-0.104
-0.339
-144.2%
jan 1, 2008
0.004
+0.108
-104.24%
jan 1, 2009
3.48
+3.475
78.99K%
jan 1, 2010
0.87
-2.61
-75.0%
jan 1, 2011
1.593
+0.723
83.1%
jan 1, 2012
-1.165
-2.758
-173.12%
jan 1, 2013
0.704
+1.869
-160.45%
jan 1, 2014
1.304
+0.6
85.22%
jan 1, 2015
0.994
-0.31
-23.81%
jan 1, 2016
1.399
+0.406
40.83%
Ranking of countries by current statistics by years


Comments: