29
/
en
AIzaSyAYiBZKx7MnpbEhh9jyipgxe19OcubqV5w
April 1, 2024
154943
India
IND
true
2
1
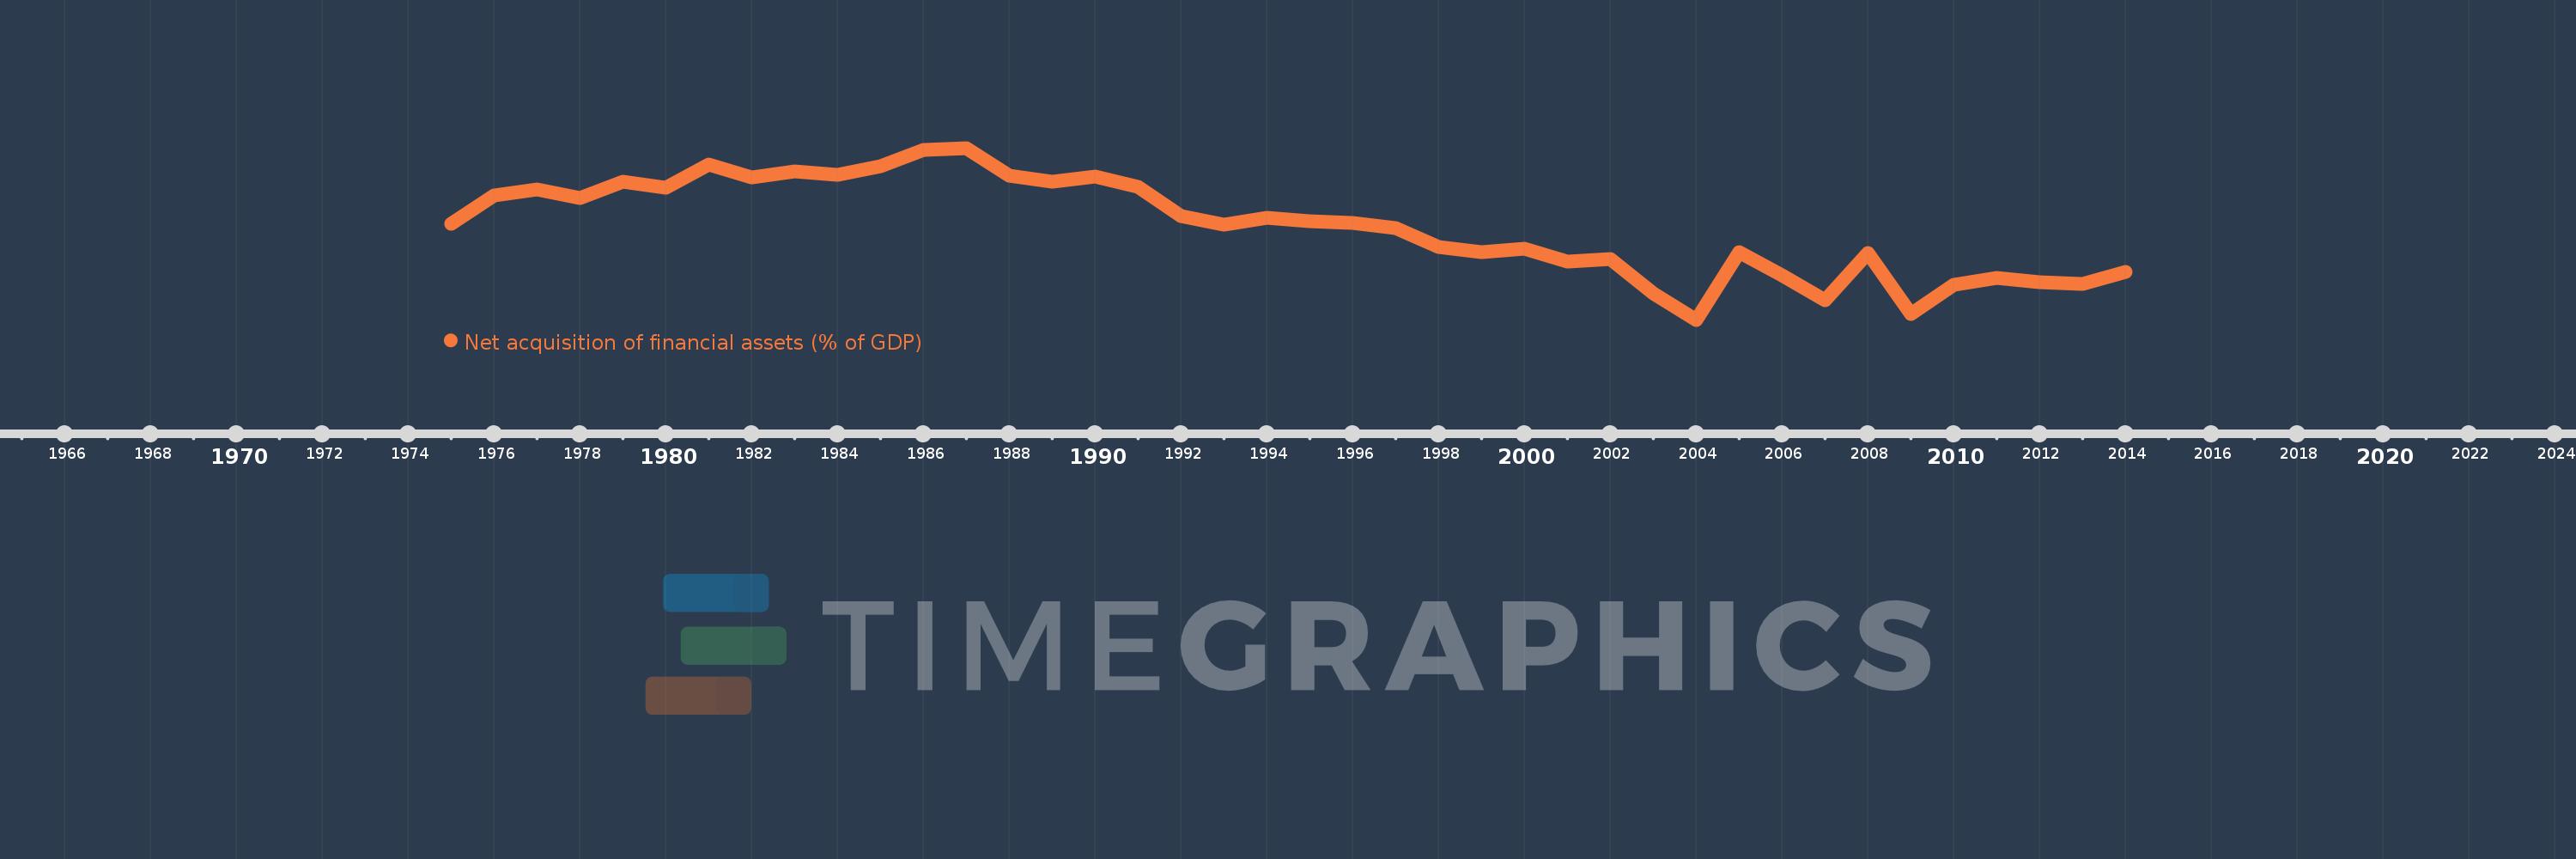
Net acquisition of financial assets (% of GDP)
2014,2013,2012,2011,2010,2009,2008,2007,2006,2005,2004,2003,2002,2001,2000,1999,1998,1997,1996,1995,1994,1993,1992,1991,1990,1989,1988,1987,1986,1985,1984,1983,1982,1981,1980,1979,1978,1977,1976,1975
This statistics in other country:
Timeline:
This timeline shows a graph from 1975 to 2014 of India. No data until 1974. Number of actual observations by date: 40.
Source name:
World Development Indicators
Source organization:
International Monetary Fund, Government Finance Statistics Yearbook and data files.
Categories, topics:
Public Sector
Last updated:
apr 23, 2017
Indicators value changes by year
Minimum:
-0.544
jan 1, 2004
At the date of observation
Value
Absolute change
Change from previous value
jan 1, 1975
2.838
+2.838
0.0%
jan 1, 1976
3.835
+0.997
35.14%
jan 1, 1977
4.073
+0.238
6.21%
jan 1, 1978
3.765
-0.308
-7.56%
jan 1, 1979
4.325
+0.56
14.87%
jan 1, 1980
4.118
-0.207
-4.79%
jan 1, 1981
4.936
+0.819
19.89%
jan 1, 1982
4.474
-0.463
-9.37%
jan 1, 1983
4.686
+0.212
4.74%
jan 1, 1984
4.565
-0.121
-2.57%
jan 1, 1985
4.884
+0.319
6.99%
jan 1, 1986
5.453
+0.569
11.65%
jan 1, 1987
5.524
+0.071
1.3%
jan 1, 1988
4.547
-0.977
-17.68%
jan 1, 1989
4.327
-0.22
-4.84%
jan 1, 1990
4.51
+0.183
4.22%
jan 1, 1991
4.157
-0.352
-7.81%
jan 1, 1992
3.11
-1.047
-25.18%
jan 1, 1993
2.816
-0.295
-9.47%
jan 1, 1994
3.067
+0.251
8.93%
jan 1, 1995
2.948
-0.12
-3.9%
jan 1, 1996
2.87
-0.077
-2.62%
jan 1, 1997
2.696
-0.175
-6.08%
jan 1, 1998
2.034
-0.662
-24.55%
jan 1, 1999
1.853
-0.18
-8.87%
jan 1, 2000
1.979
+0.126
6.8%
jan 1, 2001
1.524
-0.455
-23.0%
jan 1, 2002
1.604
+0.08
5.27%
jan 1, 2003
0.393
-1.211
-75.49%
jan 1, 2004
-0.544
-0.937
-238.31%
jan 1, 2005
1.832
+2.376
-436.85%
jan 1, 2006
1.022
-0.81
-44.23%
jan 1, 2007
0.142
-0.879
-86.07%
jan 1, 2008
1.808
+1.666
1.17K%
jan 1, 2009
-0.352
-2.161
-119.48%
jan 1, 2010
0.705
+1.057
-300.1%
jan 1, 2011
0.946
+0.241
34.22%
jan 1, 2012
0.771
-0.175
-18.45%
jan 1, 2013
0.714
-0.058
-7.47%
jan 1, 2014
1.135
+0.421
58.94%
Ranking of countries by current statistics by years


Comments: