29
/
en
AIzaSyAYiBZKx7MnpbEhh9jyipgxe19OcubqV5w
April 1, 2024
25939
Central Europe and the Baltics
CEB
false
2
1
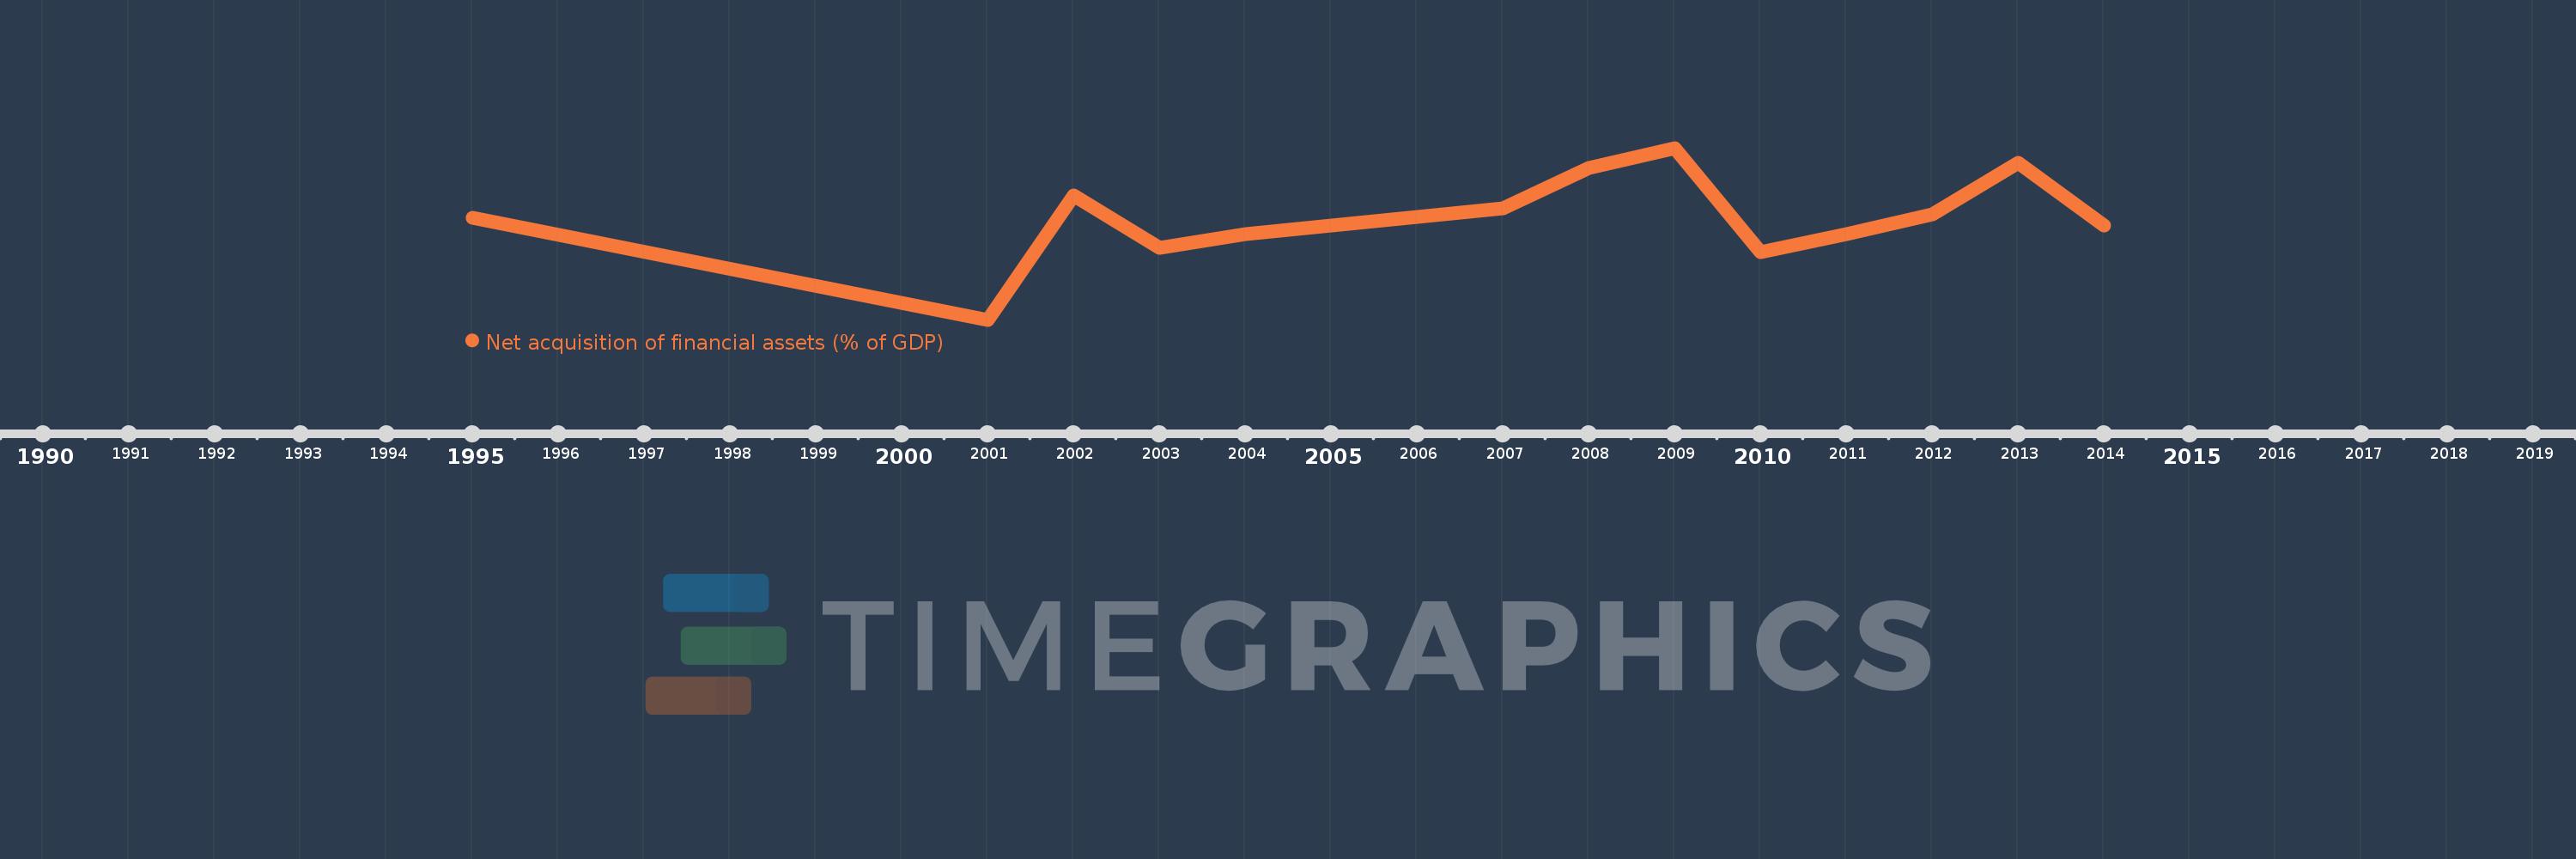
Net acquisition of financial assets (% of GDP)
2014,2013,2012,2011,2010,2009,2008,2007,2004,2003,2002,2001,1995
This statistics in other country:
Timeline:
This timeline shows a graph from 1995 to 2014 of Central Europe and the Baltics. No data until 1994. Number of actual observations by date: 13.
Source name:
World Development Indicators
Source organization:
International Monetary Fund, Government Finance Statistics Yearbook and data files.
Categories, topics:
Public Sector
Last updated:
apr 23, 2017
Indicators value changes by year
Minimum:
-1.998
jan 1, 2001
At the date of observation
Value
Absolute change
Change from previous value
jan 1, 1995
-0.239
-0.239
0.0%
jan 1, 2001
-1.998
-1.759
735.0%
jan 1, 2002
0.149
+2.147
-107.46%
jan 1, 2003
-0.757
-0.906
-608.43%
jan 1, 2004
-0.523
+0.234
-30.96%
jan 1, 2007
-0.07
+0.452
-86.53%
jan 1, 2008
0.621
+0.692
-982.34%
jan 1, 2009
0.968
+0.346
55.73%
jan 1, 2010
-0.829
-1.796
-185.65%
jan 1, 2011
-0.52
+0.308
-37.19%
jan 1, 2012
-0.181
+0.339
-65.22%
jan 1, 2013
0.712
+0.893
-493.42%
jan 1, 2014
-0.375
-1.087
-152.64%
Ranking of countries by current statistics by years


Comments: