29
/
en
AIzaSyAYiBZKx7MnpbEhh9jyipgxe19OcubqV5w
April 1, 2024
69041
Antigua and Barbuda
ATG
true
2
1
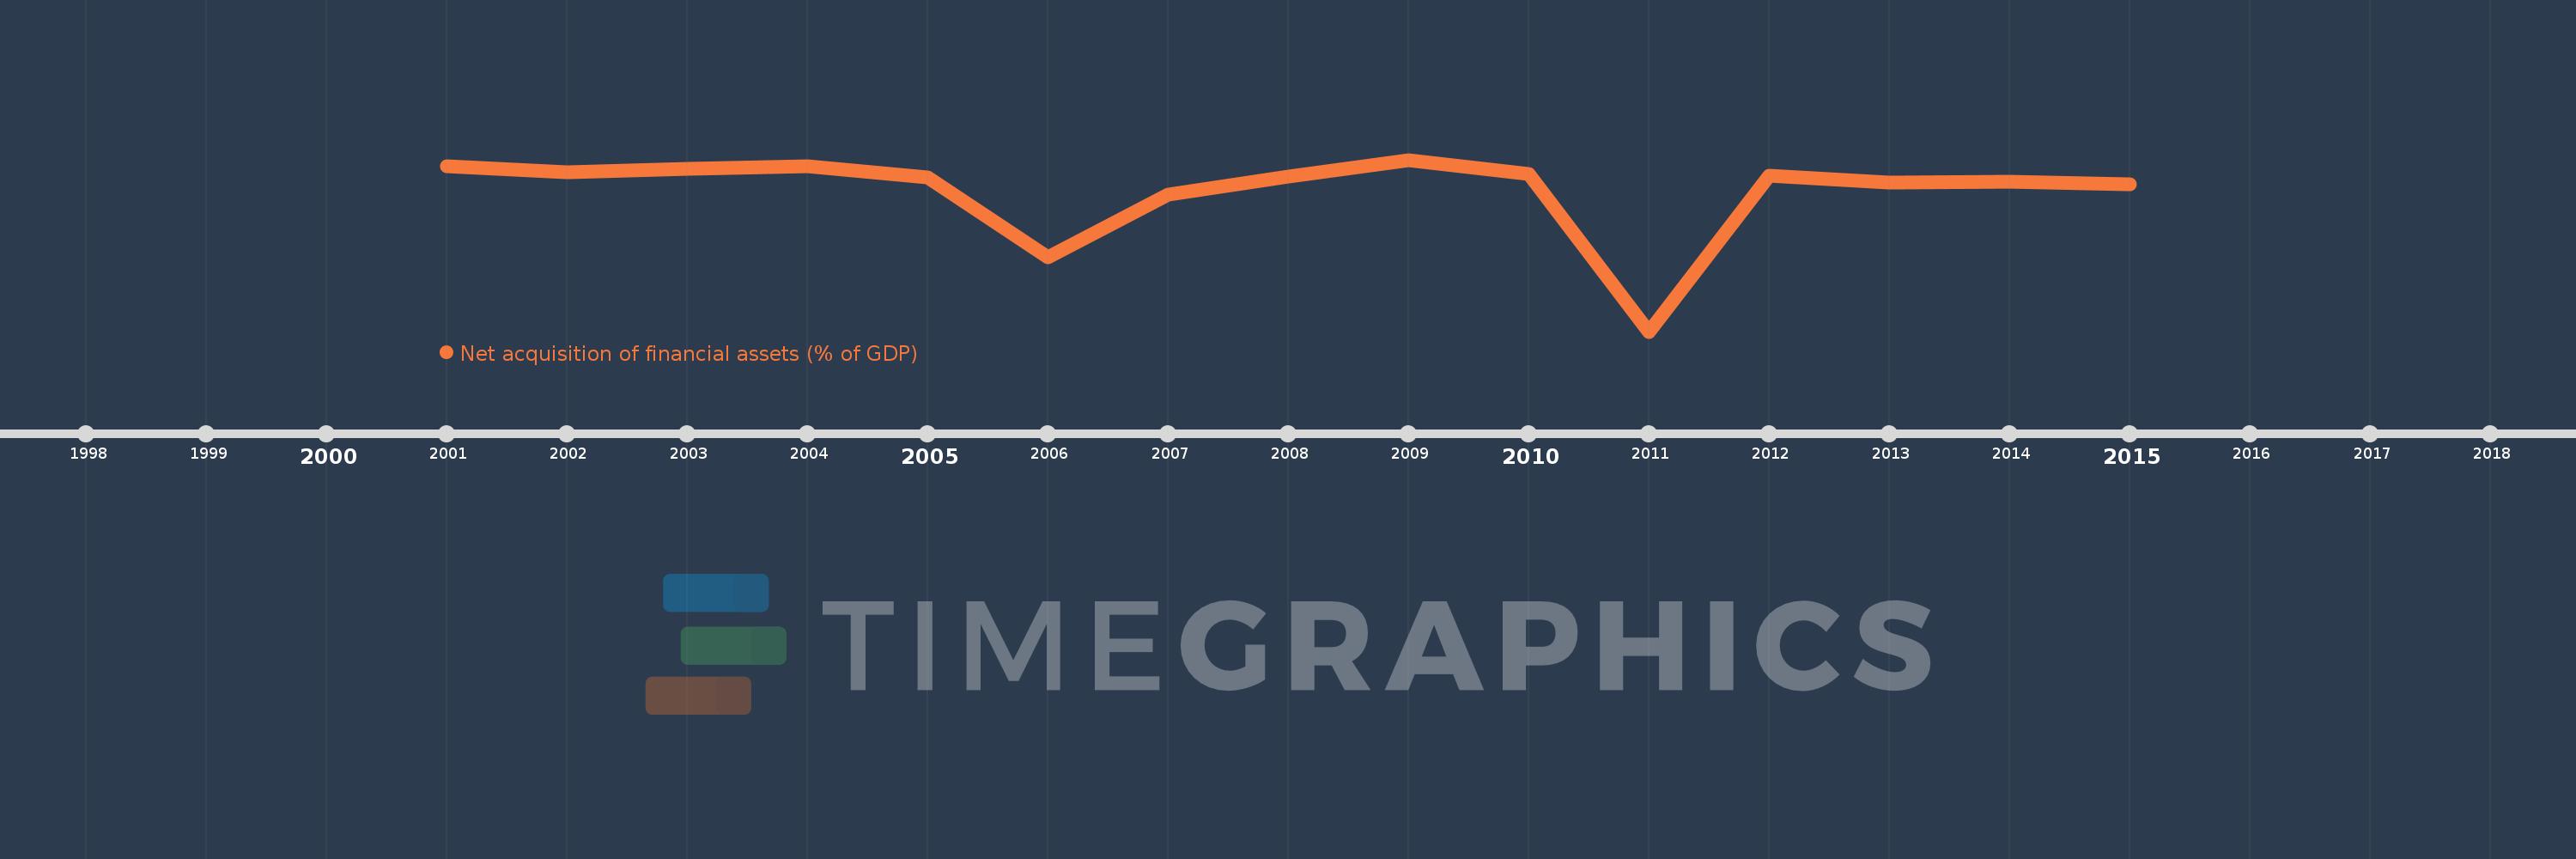
Net acquisition of financial assets (% of GDP)
2015,2014,2013,2012,2011,2010,2009,2008,2007,2006,2005,2004,2003,2002,2001
This statistics in other country:
Timeline:
This timeline shows a graph from 2001 to 2015 of Antigua and Barbuda. No data until 2000. Number of actual observations by date: 15.
Source name:
World Development Indicators
Source organization:
International Monetary Fund, Government Finance Statistics Yearbook and data files.
Categories, topics:
Public Sector
Last updated:
apr 23, 2017
Indicators value changes by year
Minimum:
-40.58
jan 1, 2011
At the date of observation
Value
Absolute change
Change from previous value
jan 1, 2001
0.308
+0.308
0.0%
jan 1, 2002
-1.072
-1.38
-447.64%
jan 1, 2003
-0.341
+0.73
-68.14%
jan 1, 2004
0.307
+0.648
-189.81%
jan 1, 2005
-2.321
-2.627
-856.88%
jan 1, 2006
-22.174
-19.853
855.42%
jan 1, 2007
-6.728
+15.446
-69.66%
jan 1, 2008
-2.219
+4.509
-67.02%
jan 1, 2009
1.965
+4.184
-188.54%
jan 1, 2010
-1.534
-3.498
-178.07%
jan 1, 2011
-40.58
-39.046
2.55K%
jan 1, 2012
-1.888
+38.692
-95.35%
jan 1, 2013
-3.597
-1.709
90.51%
jan 1, 2014
-3.368
+0.228
-6.34%
jan 1, 2015
-4.168
-0.799
23.73%
Ranking of countries by current statistics by years


Comments: