29
/
en
AIzaSyAYiBZKx7MnpbEhh9jyipgxe19OcubqV5w
April 1, 2024
125130
Egypt, Arab Rep.
EGY
true
2
1
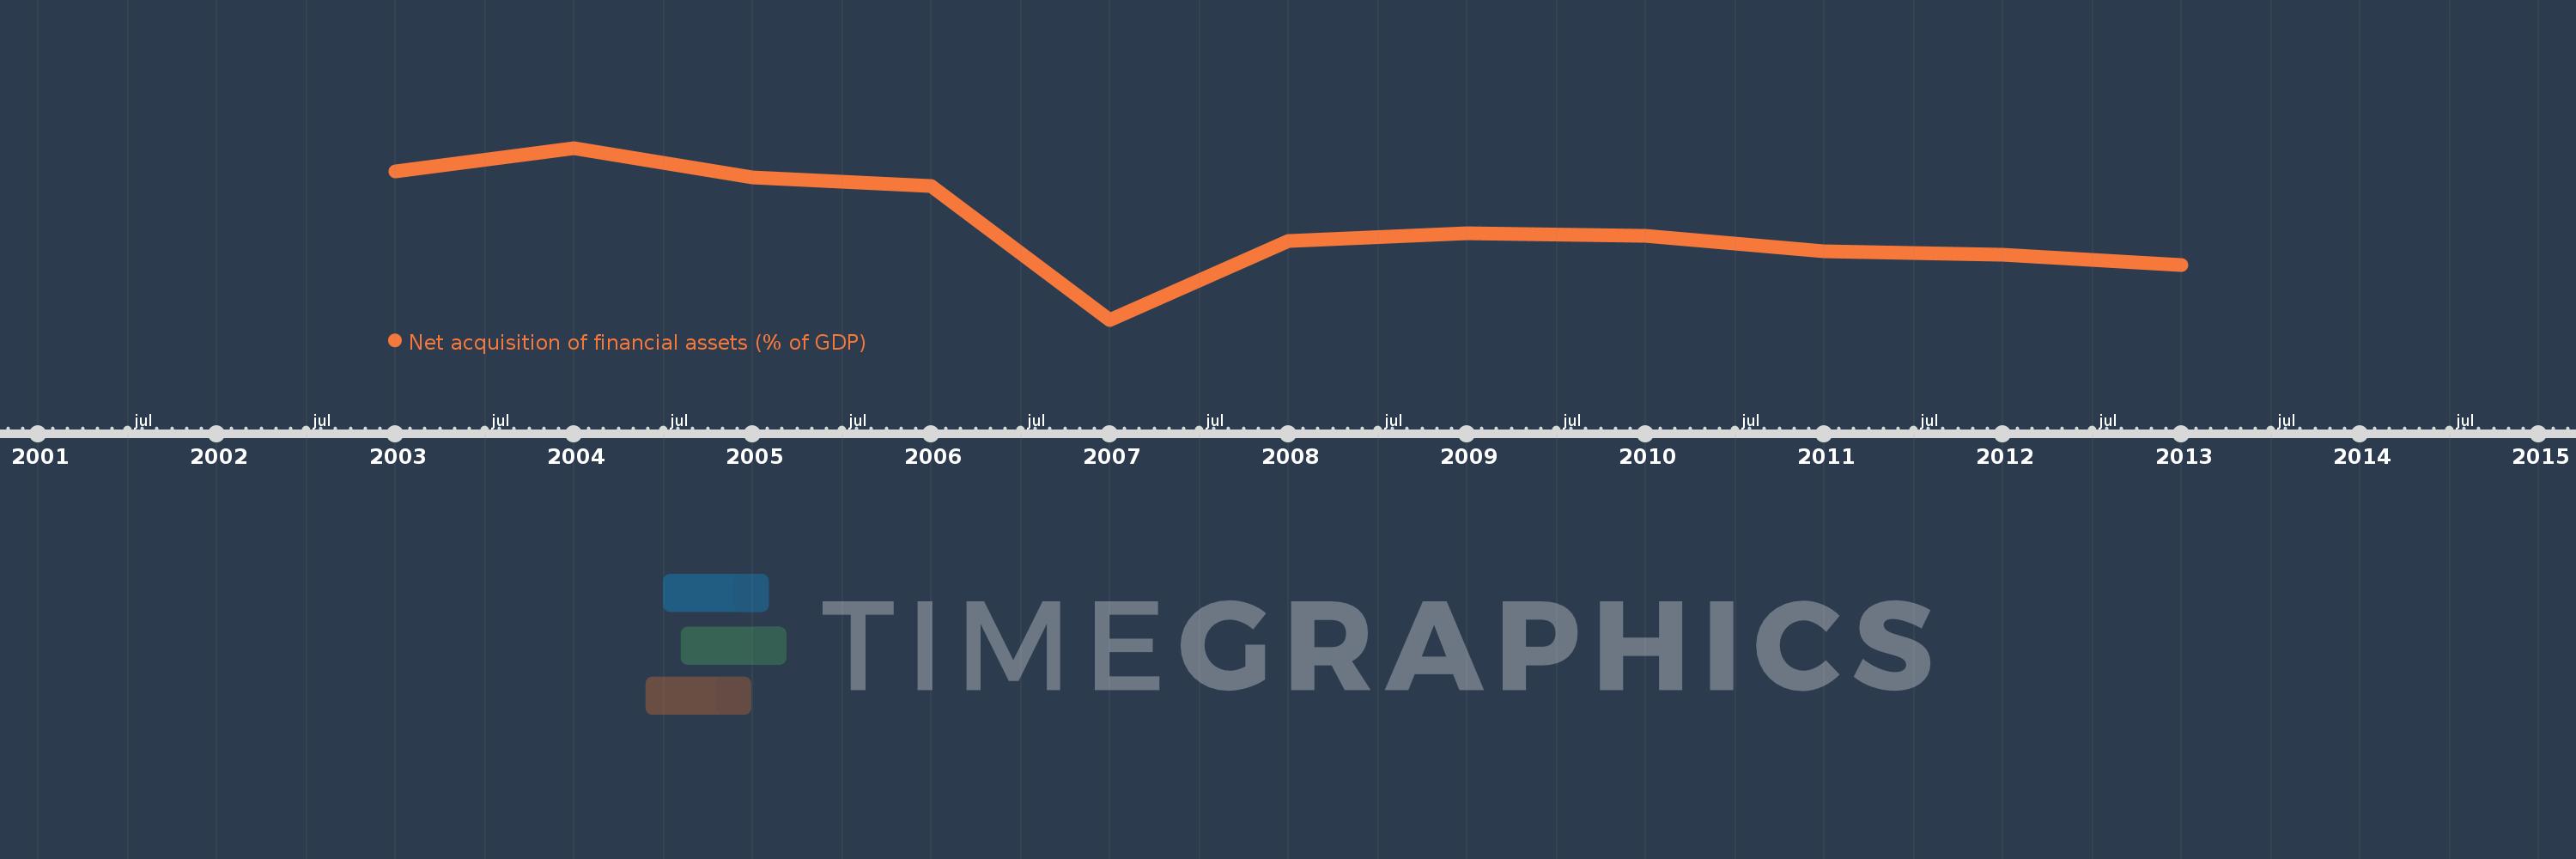
Net acquisition of financial assets (% of GDP)
2013,2012,2011,2010,2009,2008,2007,2006,2005,2004,2003
This statistics in other country:
Timeline:
This timeline shows a graph from 2003 to 2013 of Egypt, Arab Rep.. No data until 2002. Number of actual observations by date: 11.
Source name:
World Development Indicators
Source organization:
International Monetary Fund, Government Finance Statistics Yearbook and data files.
Categories, topics:
Public Sector
Last updated:
apr 23, 2017
Indicators value changes by year
Minimum:
-4.475
jan 1, 2007
Maximum:
11.058
jan 1, 2004
At the date of observation
Value
Absolute change
Change from previous value
jan 1, 2003
8.959
+8.959
0.0%
jan 1, 2004
11.058
+2.099
23.43%
jan 1, 2005
8.415
-2.643
-23.9%
jan 1, 2006
7.589
-0.826
-9.82%
jan 1, 2007
-4.475
-12.064
-158.96%
jan 1, 2008
2.628
+7.103
-158.73%
jan 1, 2009
3.362
+0.734
27.93%
jan 1, 2010
3.117
-0.245
-7.28%
jan 1, 2011
1.681
-1.436
-46.07%
jan 1, 2012
1.412
-0.269
-15.99%
jan 1, 2013
0.446
-0.966
-68.39%
Ranking of countries by current statistics by years


Comments: