29
/
en
AIzaSyAYiBZKx7MnpbEhh9jyipgxe19OcubqV5w
April 1, 2024
176716
Lebanon
LBN
true
2
1
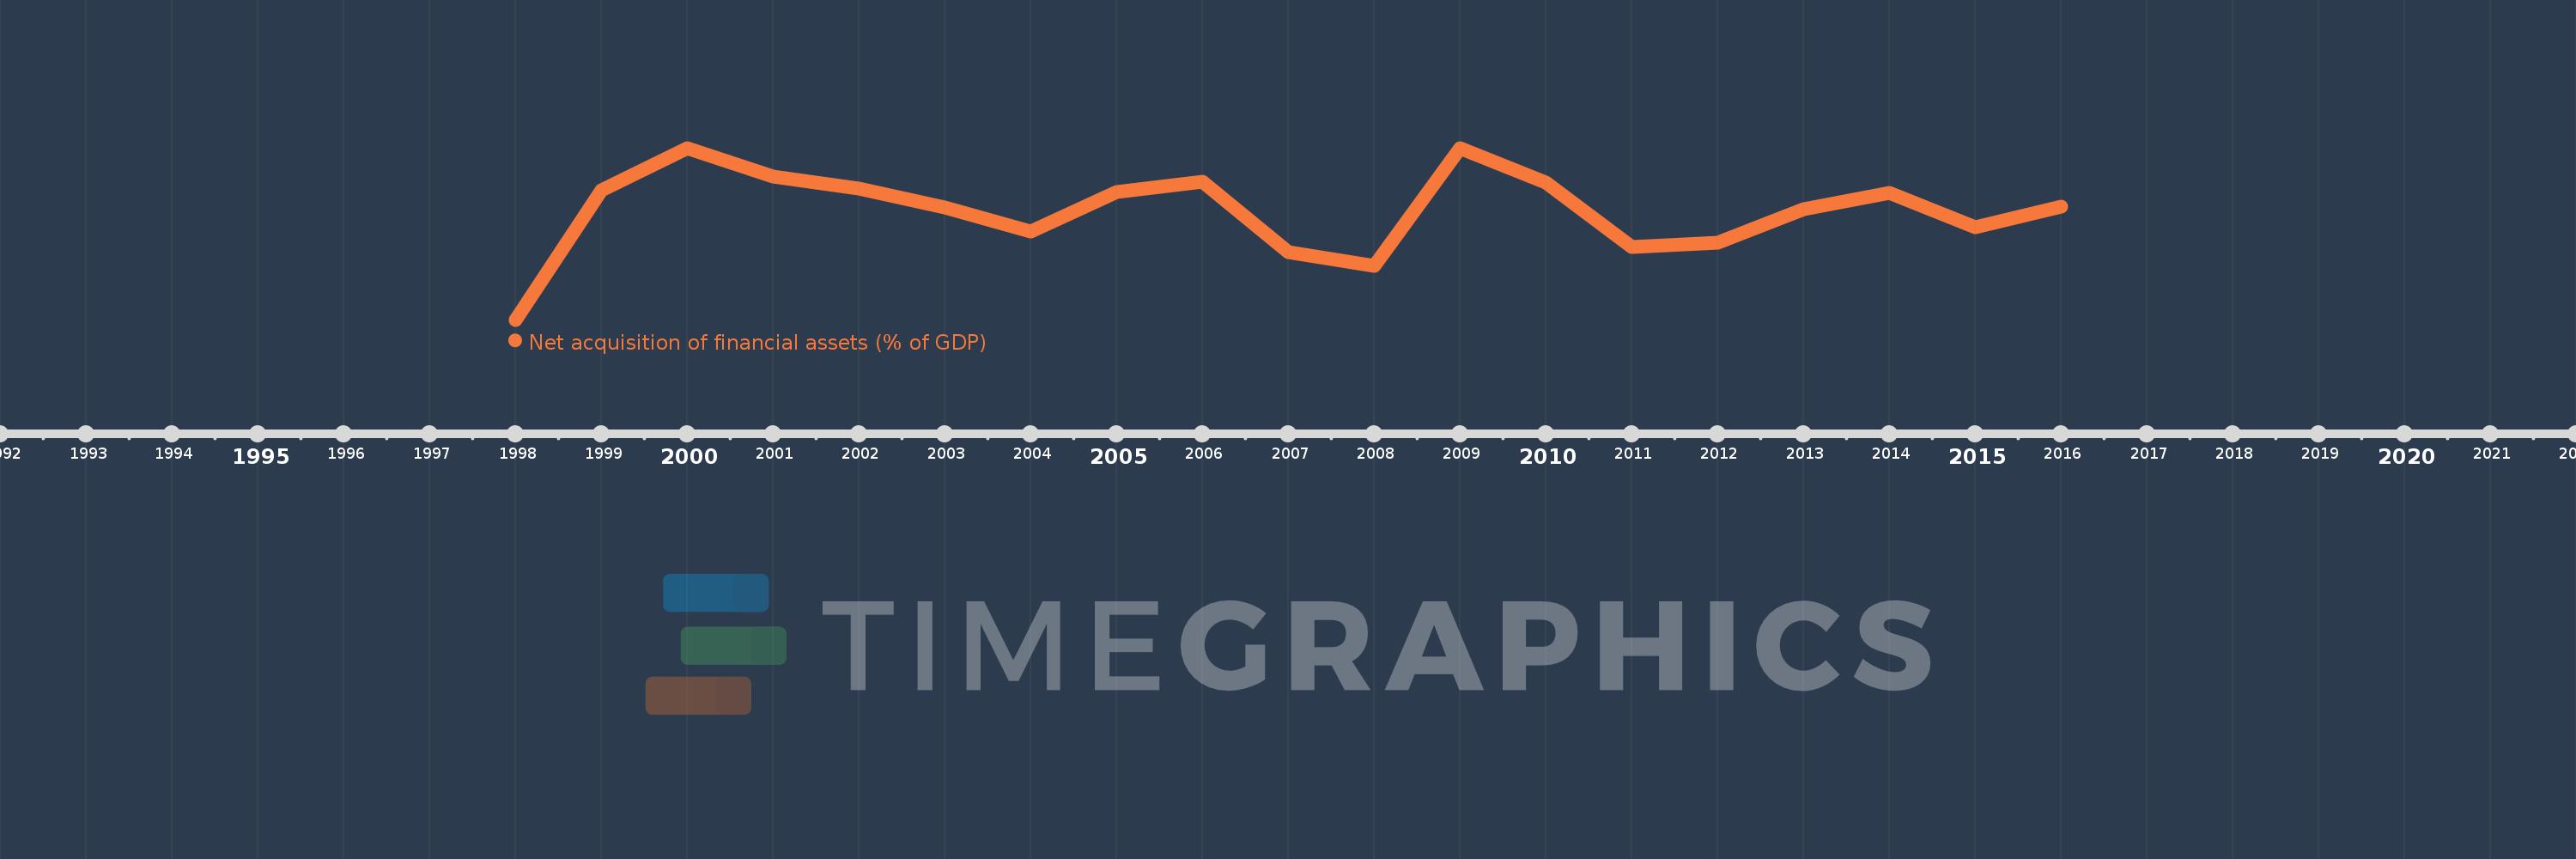
Net acquisition of financial assets (% of GDP)
2016,2015,2014,2013,2012,2011,2010,2009,2008,2007,2006,2005,2004,2003,2002,2001,2000,1999,1998
This statistics in other country:
Timeline:
This timeline shows a graph from 1998 to 2016 of Lebanon. No data until 1997. Number of actual observations by date: 19.
Source name:
World Development Indicators
Source organization:
International Monetary Fund, Government Finance Statistics Yearbook and data files.
Categories, topics:
Public Sector
Last updated:
apr 23, 2017
Indicators value changes by year
Minimum:
-10.163
jan 1, 1998
At the date of observation
Value
Absolute change
Change from previous value
jan 1, 1998
-10.163
-10.163
0.0%
jan 1, 1999
2.814
+12.978
-127.69%
jan 1, 2000
7.109
+4.295
152.62%
jan 1, 2001
4.197
-2.912
-40.96%
jan 1, 2002
3.059
-1.139
-27.13%
jan 1, 2003
1.086
-1.973
-64.5%
jan 1, 2004
-1.3
-2.386
-219.73%
jan 1, 2005
2.696
+3.997
-307.4%
jan 1, 2006
3.69
+0.994
36.86%
jan 1, 2007
-3.356
-7.046
-190.93%
jan 1, 2008
-4.744
-1.388
41.38%
jan 1, 2009
7.108
+11.852
-249.84%
jan 1, 2010
3.631
-3.478
-48.92%
jan 1, 2011
-2.883
-6.514
-179.4%
jan 1, 2012
-2.376
+0.507
-17.58%
jan 1, 2013
0.936
+3.312
-139.4%
jan 1, 2014
2.595
+1.658
177.13%
jan 1, 2015
-0.893
-3.487
-134.4%
jan 1, 2016
1.252
+2.145
-240.32%
Ranking of countries by current statistics by years


Comments: