This statistics in other country:
Timeline:
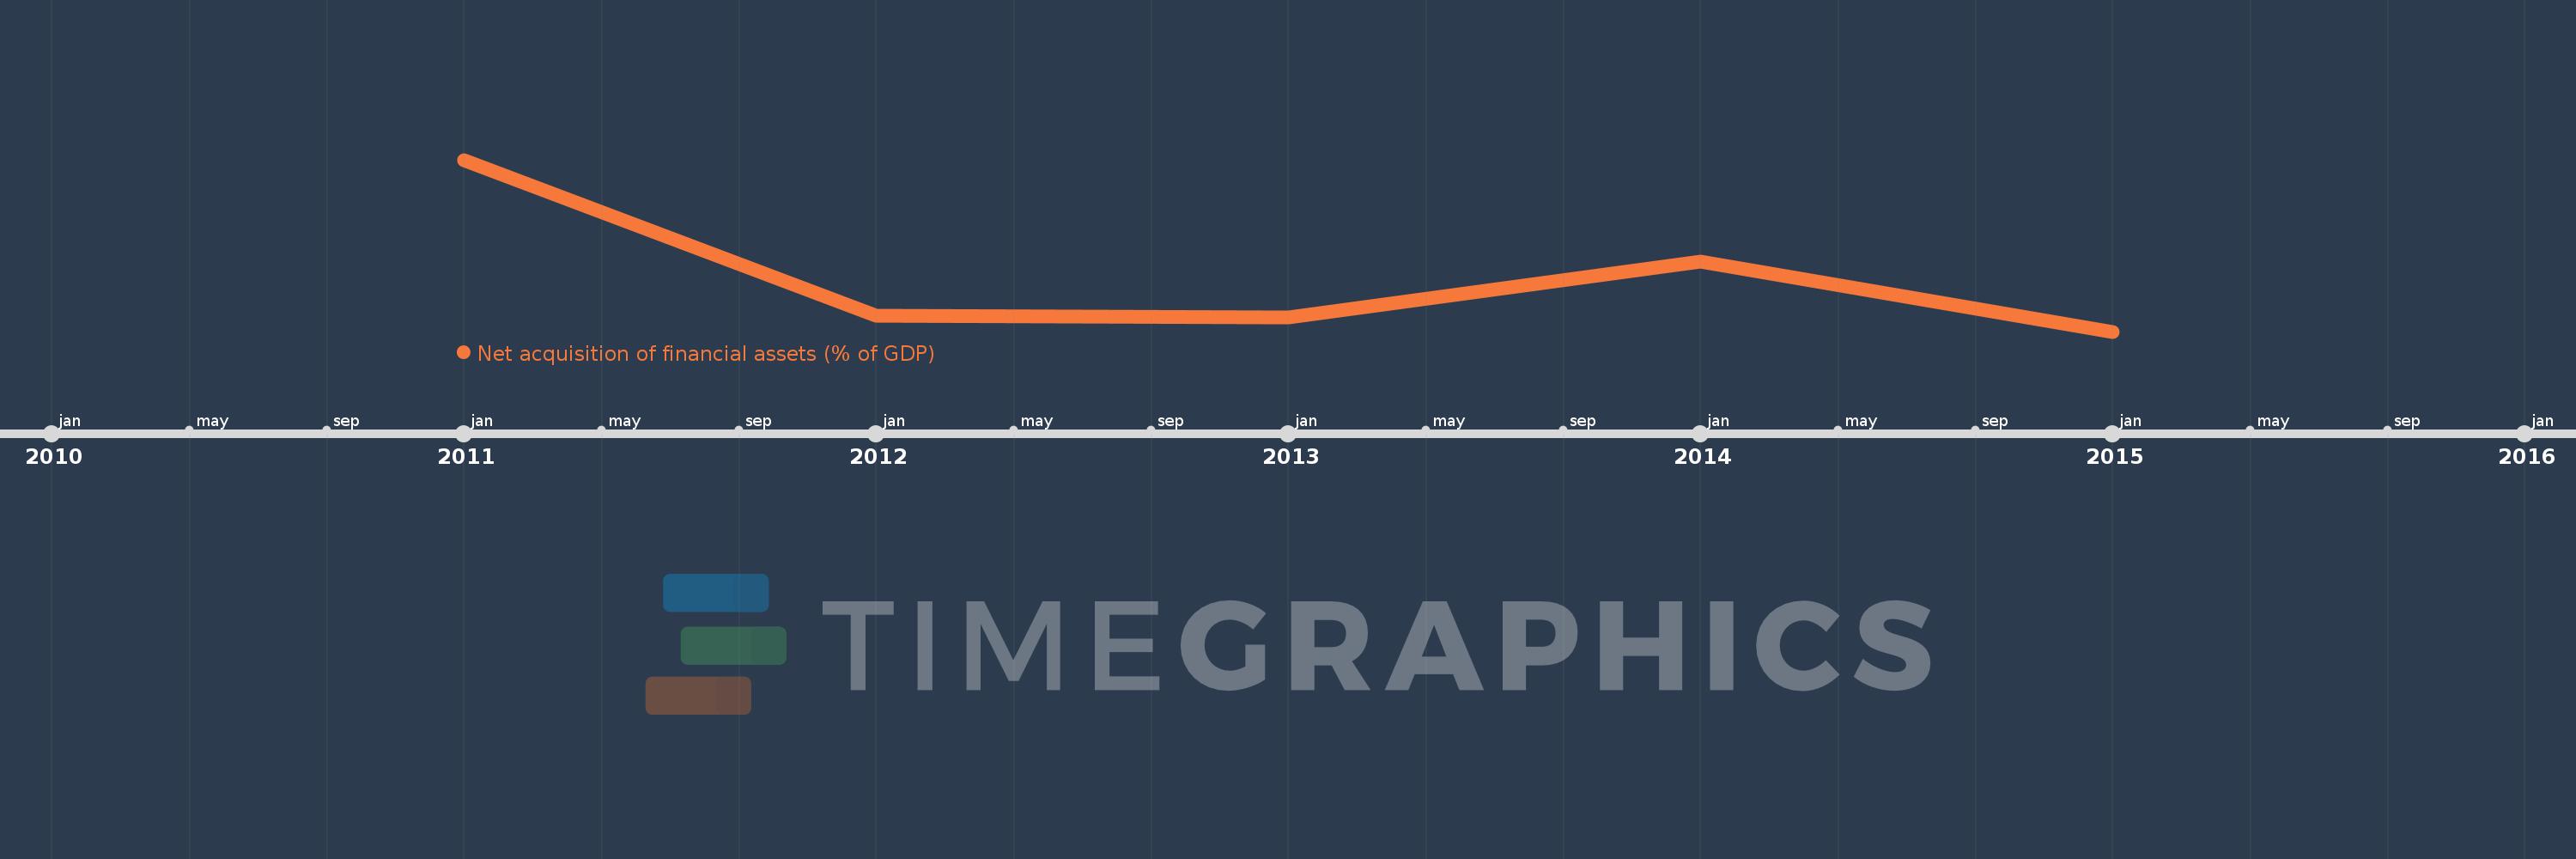
This timeline shows a graph from 2011 to 2015 of Samoa. No data until 2010. Number of actual observations by date: 5.
Source name:
World Development Indicators
Source organization:
International Monetary Fund, Government Finance Statistics Yearbook and data files.
Categories, topics:
Public Sector
Last updated:
apr 23, 2017
Indicators value changes by year
Minimum:
-0.559
jan 1, 2015
At the date of observation
Value
Absolute change
Change from previous value
jan 1, 2011
2.621
+2.621
0.0%
jan 1, 2012
-0.264
-2.884
-110.05%
jan 1, 2013
-0.301
-0.037
14.23%
jan 1, 2014
0.735
+1.036
-344.04%
jan 1, 2015
-0.559
-1.293
-176.04%
Ranking of countries by current statistics by years


Comments: