29
/
en
AIzaSyAYiBZKx7MnpbEhh9jyipgxe19OcubqV5w
April 1, 2024
207074
Nepal
NPL
true
2
1
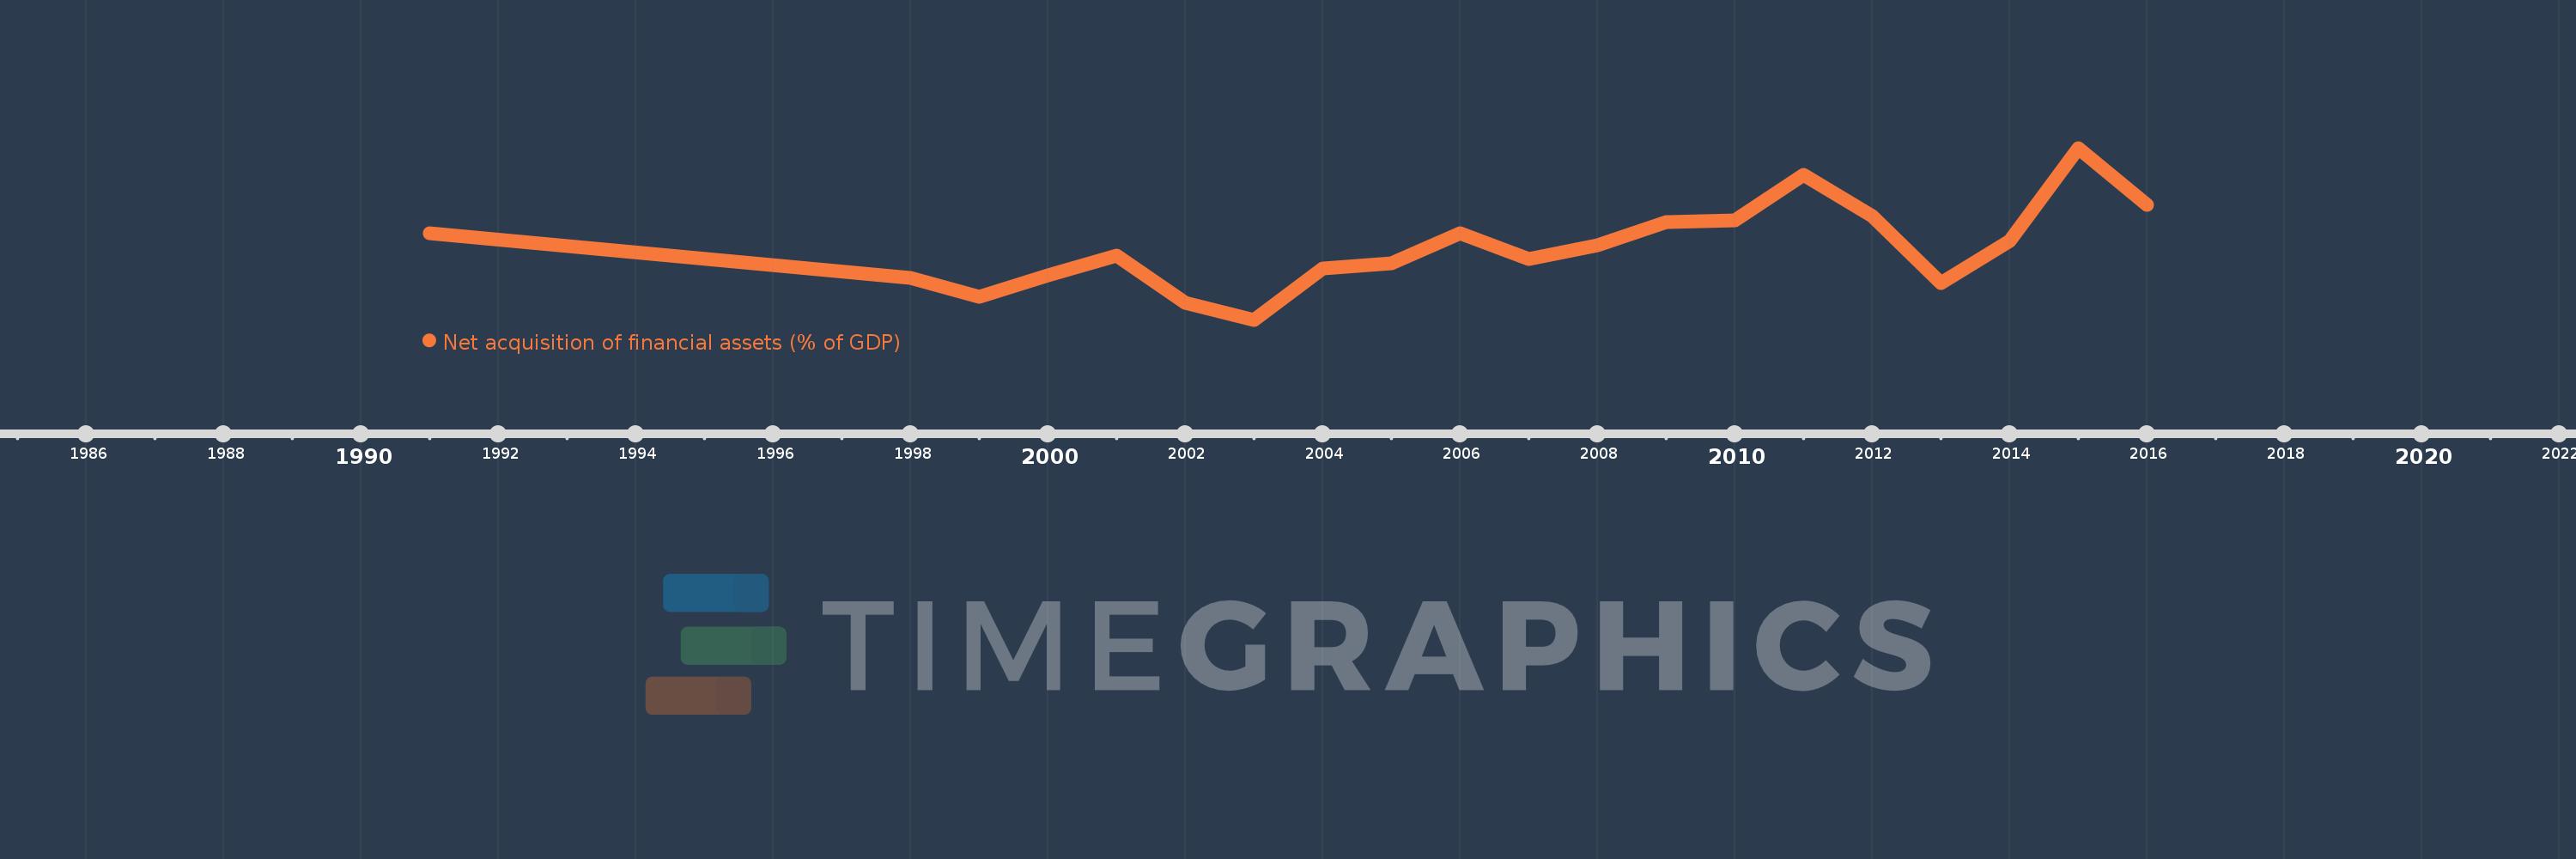
Net acquisition of financial assets (% of GDP)
2016,2015,2014,2013,2012,2011,2010,2009,2008,2007,2006,2005,2004,2003,2002,2001,2000,1999,1998,1991
This statistics in other country:
Timeline:
This timeline shows a graph from 1991 to 2016 of Nepal. No data until 1990. Number of actual observations by date: 20.
Source name:
World Development Indicators
Source organization:
International Monetary Fund, Government Finance Statistics Yearbook and data files.
Categories, topics:
Public Sector
Last updated:
apr 23, 2017
Indicators value changes by year
Minimum:
-1.985
jan 1, 2003
At the date of observation
Value
Absolute change
Change from previous value
jan 1, 1991
-0.195
-0.195
0.0%
jan 1, 1998
-1.123
-0.928
476.33%
jan 1, 1999
-1.511
-0.388
34.56%
jan 1, 2000
-1.069
+0.442
-29.28%
jan 1, 2001
-0.658
+0.41
-38.4%
jan 1, 2002
-1.629
-0.97
147.43%
jan 1, 2003
-1.985
-0.356
21.85%
jan 1, 2004
-0.924
+1.061
-53.44%
jan 1, 2005
-0.817
+0.107
-11.55%
jan 1, 2006
-0.185
+0.632
-77.37%
jan 1, 2007
-0.726
-0.541
292.45%
jan 1, 2008
-0.433
+0.293
-40.33%
jan 1, 2009
0.036
+0.469
-108.2%
jan 1, 2010
0.071
+0.036
100.34%
jan 1, 2011
1.017
+0.946
1.33K%
jan 1, 2012
0.168
-0.85
-83.5%
jan 1, 2013
-1.22
-1.388
-826.56%
jan 1, 2014
-0.345
+0.875
-71.7%
jan 1, 2015
1.578
+1.924
-557.2%
jan 1, 2016
0.396
-1.182
-74.9%
Ranking of countries by current statistics by years


Comments: