29
/
en
AIzaSyAYiBZKx7MnpbEhh9jyipgxe19OcubqV5w
April 1, 2024
88861
Bosnia and Herzegovina
BIH
true
2
1
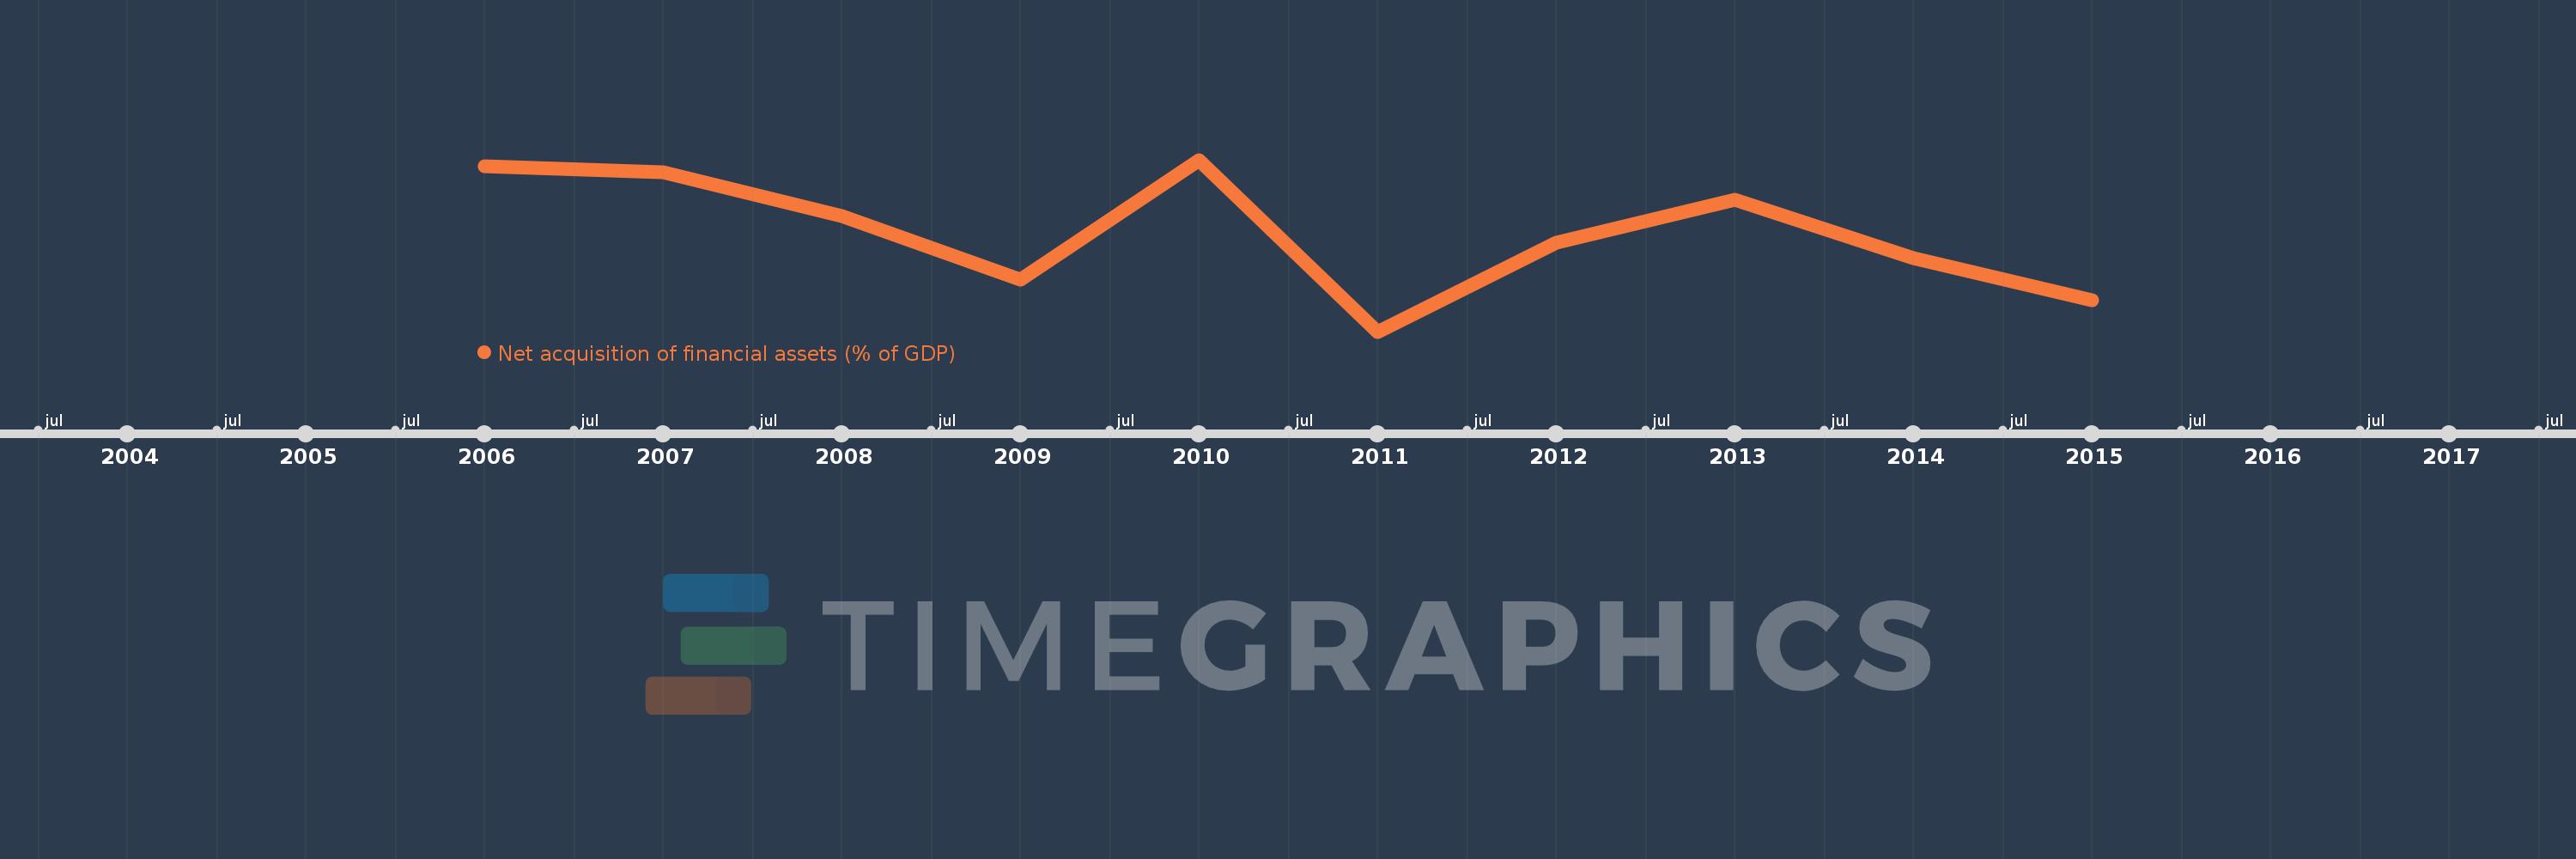
Net acquisition of financial assets (% of GDP)
2015,2014,2013,2012,2011,2010,2009,2008,2007,2006
This statistics in other country:
Timeline:
This timeline shows a graph from 2006 to 2015 of Bosnia and Herzegovina. No data until 2005. Number of actual observations by date: 10.
Source name:
World Development Indicators
Source organization:
International Monetary Fund, Government Finance Statistics Yearbook and data files.
Categories, topics:
Public Sector
Last updated:
apr 23, 2017
Indicators value changes by year
Minimum:
-0.377
jan 1, 2011
At the date of observation
Value
Absolute change
Change from previous value
jan 1, 2006
2.438
+2.438
0.0%
jan 1, 2007
2.347
-0.091
-3.73%
jan 1, 2008
1.593
-0.755
-32.15%
jan 1, 2009
0.517
-1.076
-67.55%
jan 1, 2010
2.555
+2.039
394.47%
jan 1, 2011
-0.377
-2.932
-114.73%
jan 1, 2012
1.145
+1.521
-403.99%
jan 1, 2013
1.869
+0.724
63.28%
jan 1, 2014
0.88
-0.989
-52.9%
jan 1, 2015
0.162
-0.718
-81.56%
Ranking of countries by current statistics by years


Comments: