29
/
en
AIzaSyAYiBZKx7MnpbEhh9jyipgxe19OcubqV5w
April 1, 2024
255457
Swaziland
SWZ
true
2
1
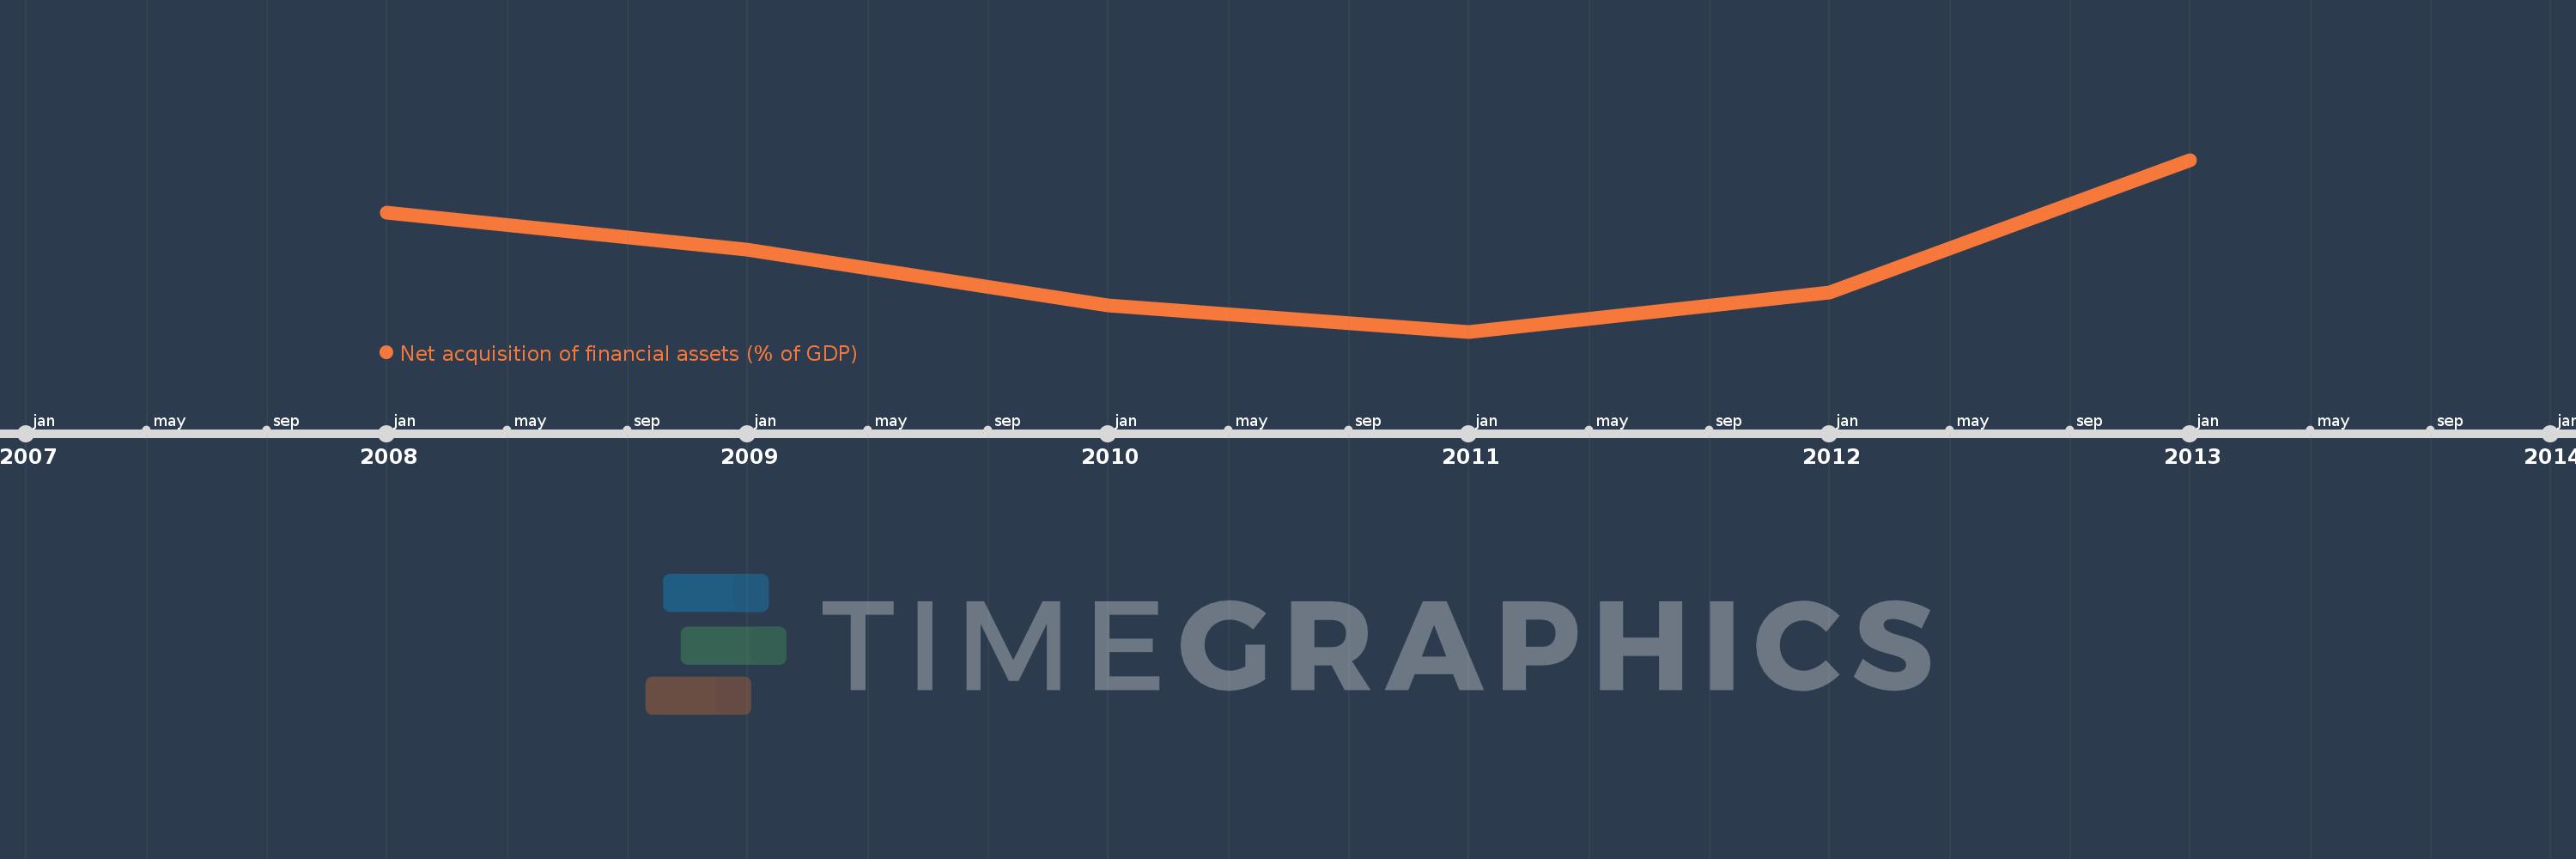
Net acquisition of financial assets (% of GDP)
2013,2012,2011,2010,2009,2008
This statistics in other country:
Timeline:
This timeline shows a graph from 2008 to 2013 of Swaziland. No data until 2007. Number of actual observations by date: 6.
Source name:
World Development Indicators
Source organization:
International Monetary Fund, Government Finance Statistics Yearbook and data files.
Categories, topics:
Public Sector
Last updated:
apr 23, 2017
Indicators value changes by year
Minimum:
-10.308
jan 1, 2011
At the date of observation
Value
Absolute change
Change from previous value
jan 1, 2008
0.239
+0.239
0.0%
jan 1, 2009
-3.016
-3.255
-1.36K%
jan 1, 2010
-7.969
-4.952
164.17%
jan 1, 2011
-10.308
-2.34
29.36%
jan 1, 2012
-6.816
+3.492
-33.88%
jan 1, 2013
4.971
+11.787
-172.94%
Ranking of countries by current statistics by years


Comments: