29
/
en
AIzaSyAYiBZKx7MnpbEhh9jyipgxe19OcubqV5w
April 1, 2024
196825
Micronesia, Fed. Sts.
FSM
true
2
1
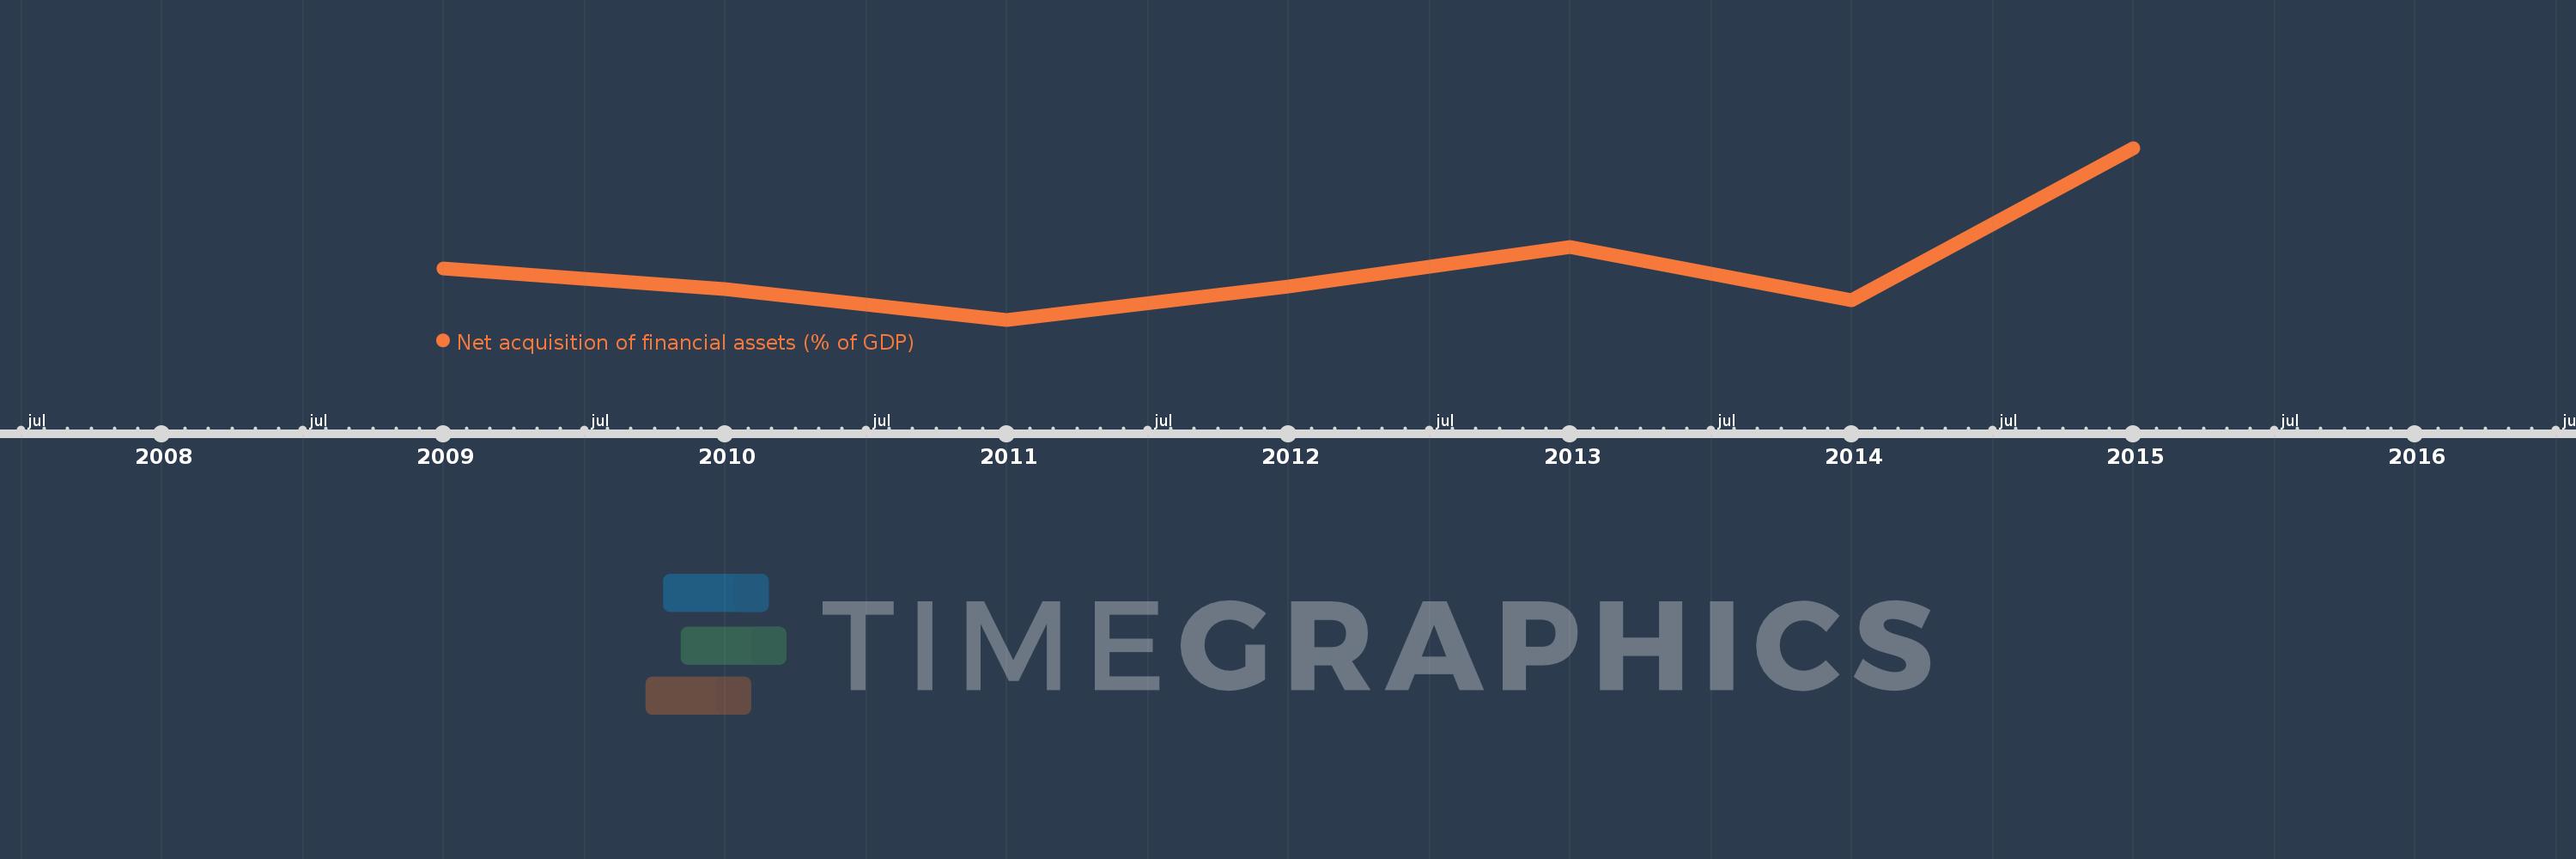
Net acquisition of financial assets (% of GDP)
2015,2014,2013,2012,2011,2010,2009
This statistics in other country:
Timeline:
This timeline shows a graph from 2009 to 2015 of Micronesia, Fed. Sts.. No data until 2008. Number of actual observations by date: 7.
Source name:
World Development Indicators
Source organization:
International Monetary Fund, Government Finance Statistics Yearbook and data files.
Categories, topics:
Public Sector
Last updated:
apr 23, 2017
Indicators value changes by year
Maximum:
10.724
jan 1, 2015
At the date of observation
Value
Absolute change
Change from previous value
jan 1, 2009
3.719
+3.719
0.0%
jan 1, 2010
2.505
-1.214
-32.65%
jan 1, 2011
0.748
-1.757
-70.12%
jan 1, 2012
2.693
+1.945
259.9%
jan 1, 2013
4.986
+2.293
85.13%
jan 1, 2014
1.885
-3.101
-62.19%
jan 1, 2015
10.724
+8.839
468.84%
Ranking of countries by current statistics by years


Comments: