29
/
en
AIzaSyAYiBZKx7MnpbEhh9jyipgxe19OcubqV5w
April 1, 2024
194563
Mauritius
MUS
true
2
1
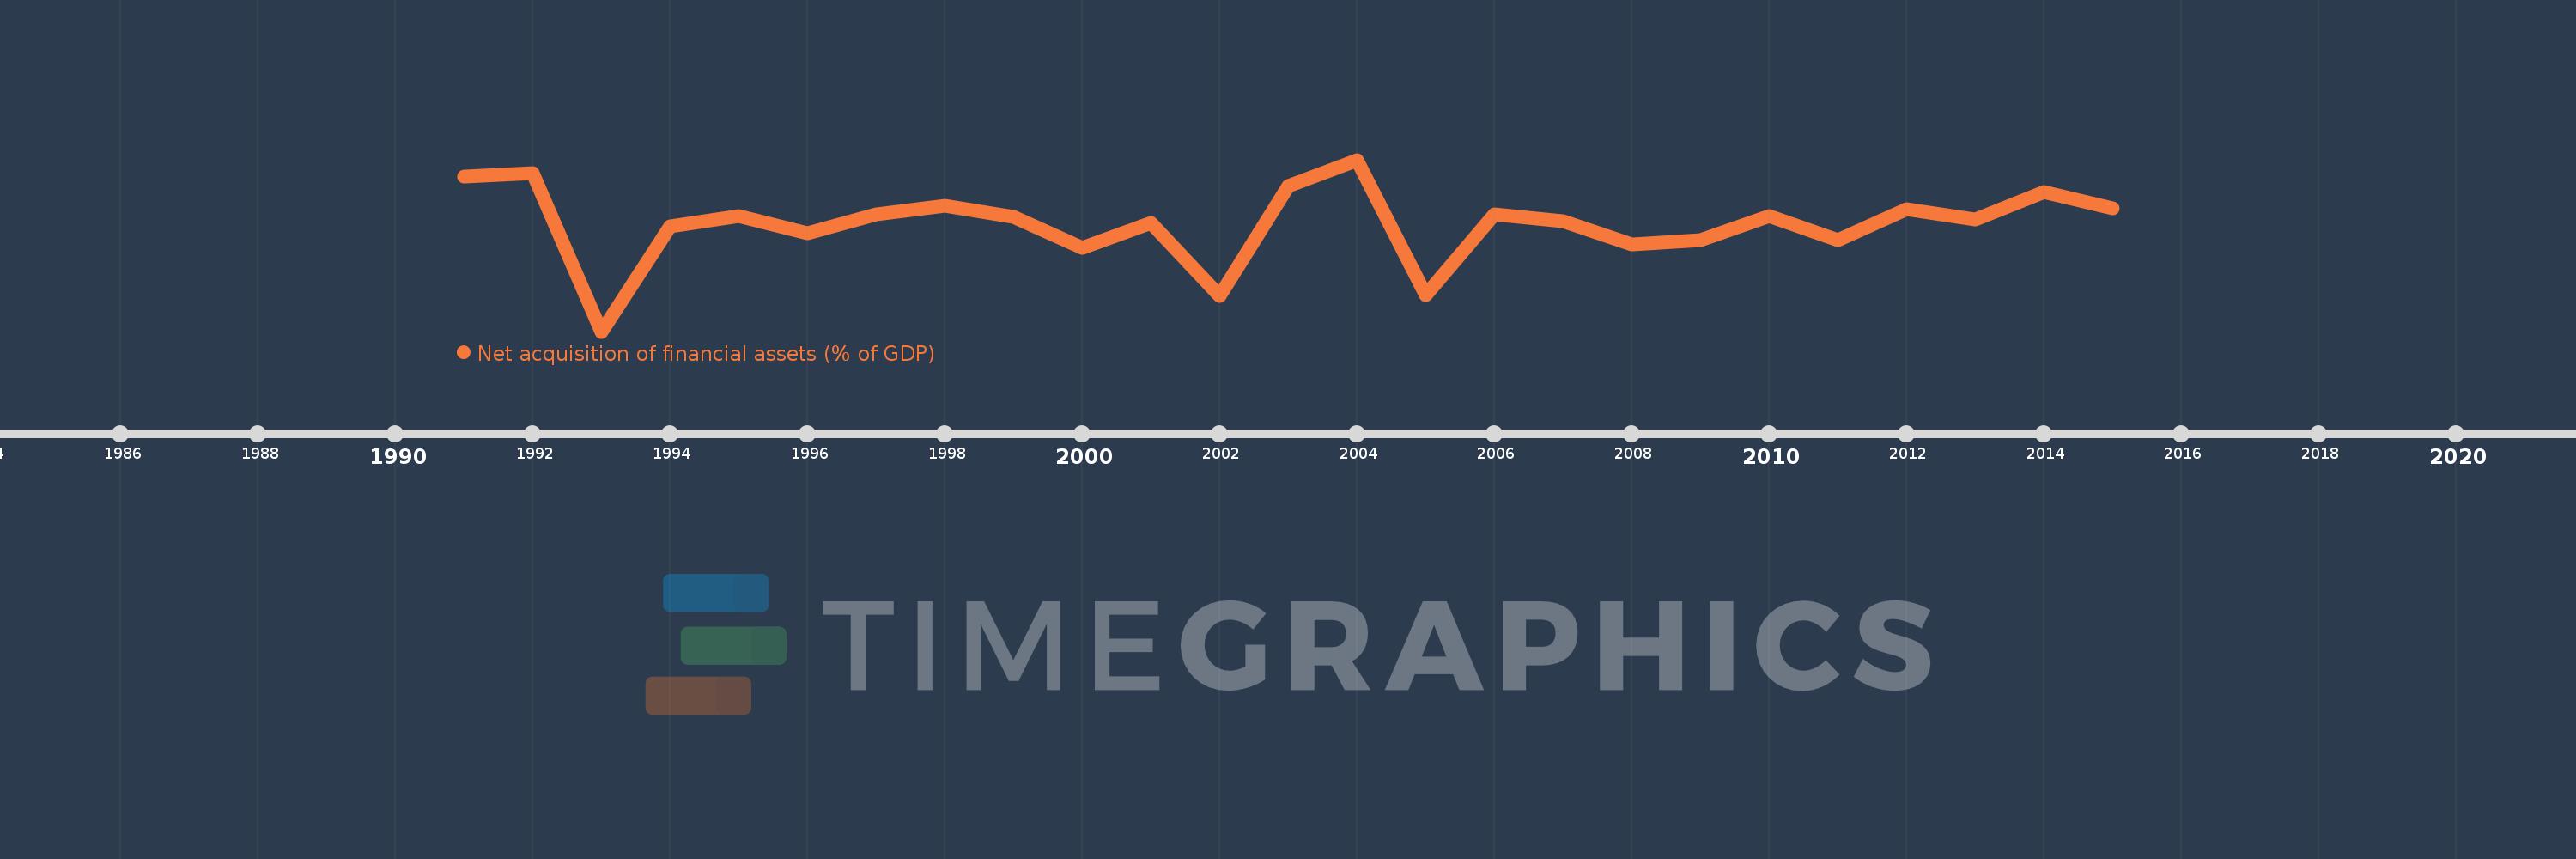
Net acquisition of financial assets (% of GDP)
2015,2014,2013,2012,2011,2010,2009,2008,2007,2006,2005,2004,2003,2002,2001,2000,1999,1998,1997,1996,1995,1994,1993,1992,1991
This statistics in other country:
Timeline:
This timeline shows a graph from 1991 to 2015 of Mauritius. No data until 1990. Number of actual observations by date: 25.
Source name:
World Development Indicators
Source organization:
International Monetary Fund, Government Finance Statistics Yearbook and data files.
Categories, topics:
Public Sector
Last updated:
apr 23, 2017
Indicators value changes by year
Minimum:
-7.437
jan 1, 1993
At the date of observation
Value
Absolute change
Change from previous value
jan 1, 1991
3.806
+3.806
0.0%
jan 1, 1992
4.046
+0.24
6.3%
jan 1, 1993
-7.437
-11.482
-283.82%
jan 1, 1994
0.161
+7.597
-102.16%
jan 1, 1995
0.942
+0.782
486.81%
jan 1, 1996
-0.331
-1.273
-135.1%
jan 1, 1997
1.027
+1.358
-410.47%
jan 1, 1998
1.683
+0.656
63.83%
jan 1, 1999
0.847
-0.836
-49.69%
jan 1, 2000
-1.346
-2.193
-259.01%
jan 1, 2001
0.421
+1.767
-131.26%
jan 1, 2002
-4.832
-5.253
-1.25K%
jan 1, 2003
3.091
+7.923
-163.96%
jan 1, 2004
5.01
+1.919
62.1%
jan 1, 2005
-4.784
-9.794
-195.49%
jan 1, 2006
1.075
+5.859
-122.48%
jan 1, 2007
0.542
-0.533
-49.57%
jan 1, 2008
-1.115
-1.657
-305.56%
jan 1, 2009
-0.84
+0.275
-24.65%
jan 1, 2010
0.926
+1.766
-210.25%
jan 1, 2011
-0.816
-1.742
-188.1%
jan 1, 2012
1.412
+2.228
-273.06%
jan 1, 2013
0.685
-0.727
-51.5%
jan 1, 2014
2.668
+1.984
289.67%
jan 1, 2015
1.522
-1.147
-42.97%
Ranking of countries by current statistics by years


Comments: