29
/
en
AIzaSyAYiBZKx7MnpbEhh9jyipgxe19OcubqV5w
April 1, 2024
68038
Angola
AGO
true
2
1
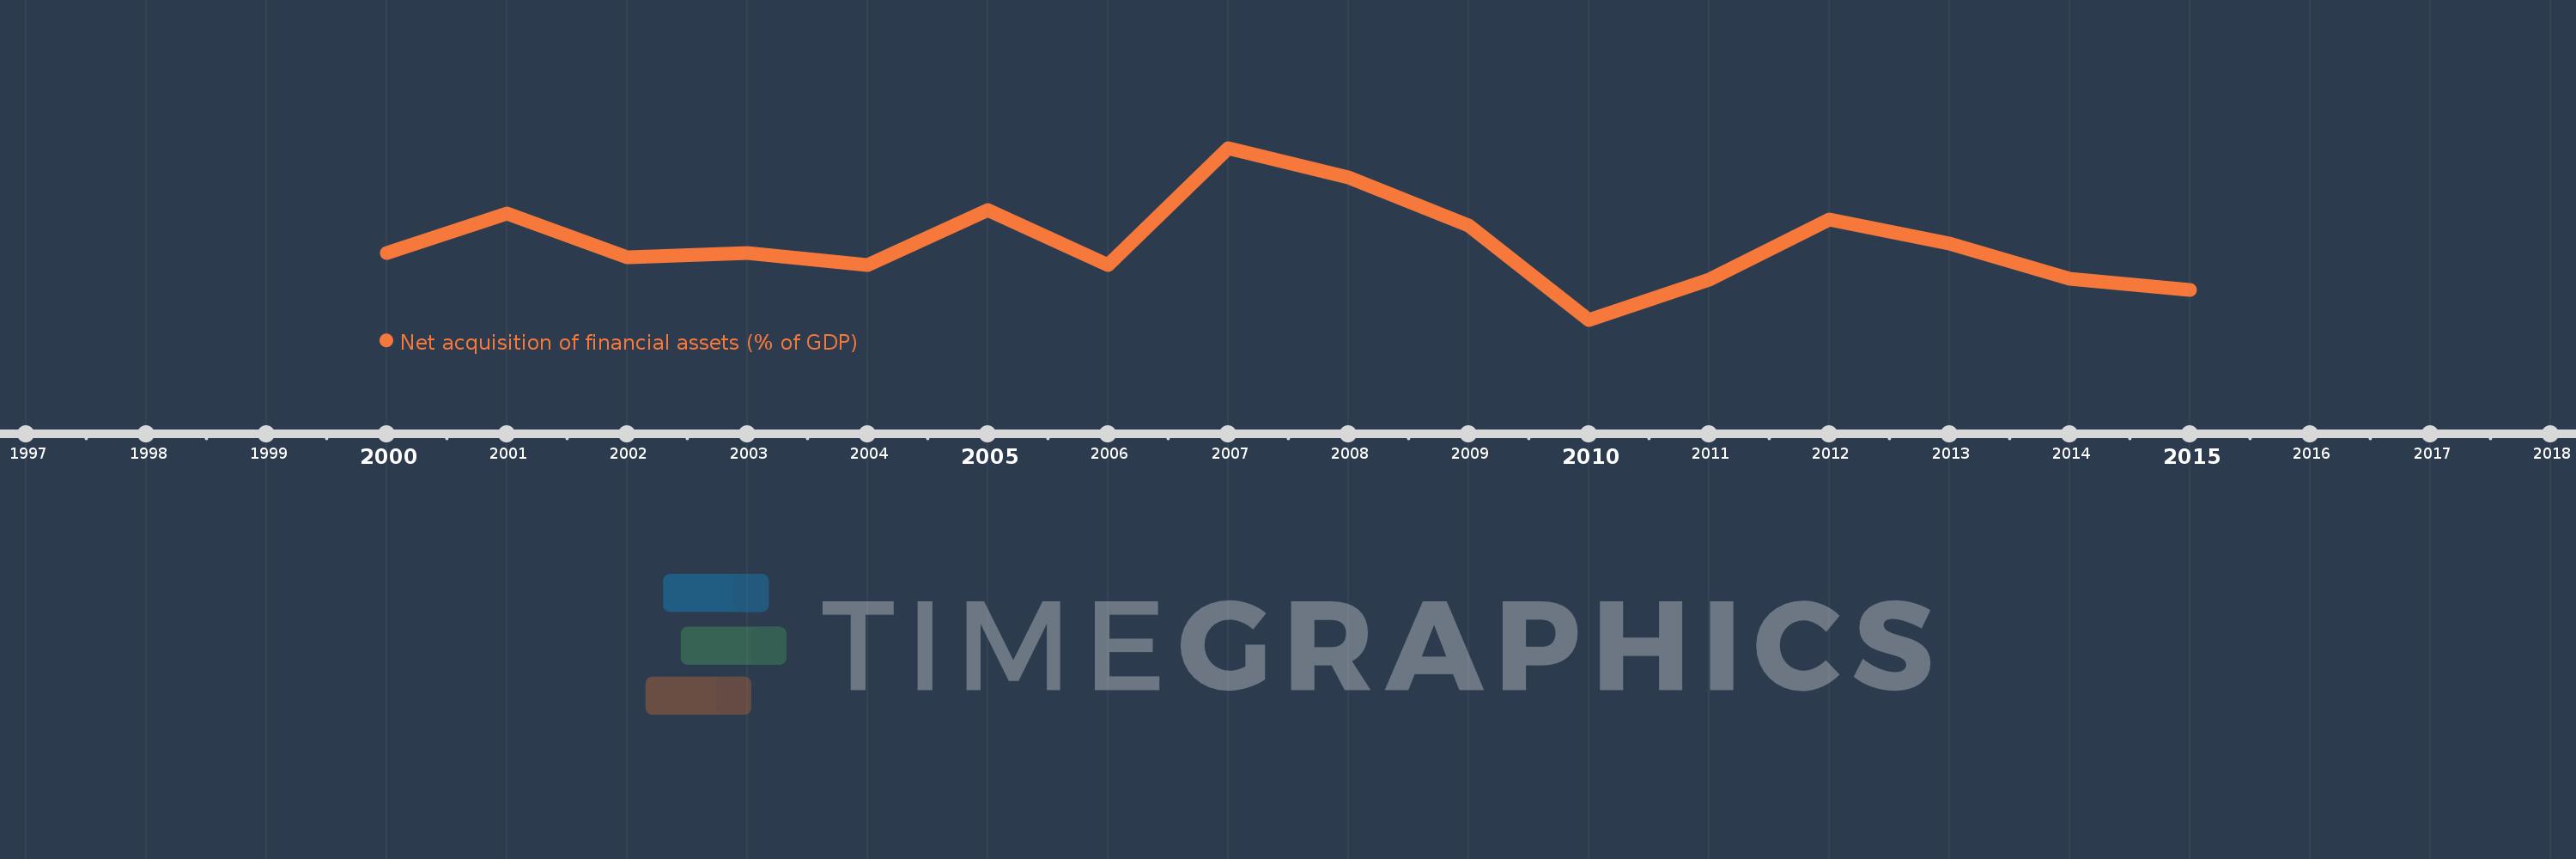
Net acquisition of financial assets (% of GDP)
2015,2014,2013,2012,2011,2010,2009,2008,2007,2006,2005,2004,2003,2002,2001,2000
This statistics in other country:
Timeline:
This timeline shows a graph from 2000 to 2015 of Angola. No data until 1999. Number of actual observations by date: 16.
Source name:
World Development Indicators
Source organization:
International Monetary Fund, Government Finance Statistics Yearbook and data files.
Categories, topics:
Public Sector
Last updated:
apr 23, 2017
Indicators value changes by year
Minimum:
-9.205
jan 1, 2010
Maximum:
23.058
jan 1, 2007
At the date of observation
Value
Absolute change
Change from previous value
jan 1, 2000
3.356
+3.356
0.0%
jan 1, 2001
10.795
+7.44
221.71%
jan 1, 2002
2.507
-8.289
-76.78%
jan 1, 2003
3.295
+0.788
31.44%
jan 1, 2004
1.075
-2.221
-67.39%
jan 1, 2005
11.417
+10.342
962.51%
jan 1, 2006
1.016
-10.4
-91.1%
jan 1, 2007
23.058
+22.042
2.17K%
jan 1, 2008
17.449
-5.61
-24.33%
jan 1, 2009
8.474
-8.975
-51.44%
jan 1, 2010
-9.205
-17.678
-208.63%
jan 1, 2011
-1.731
+7.474
-81.2%
jan 1, 2012
9.651
+11.381
-657.55%
jan 1, 2013
5.098
-4.553
-47.18%
jan 1, 2014
-1.486
-6.584
-129.15%
jan 1, 2015
-3.59
-2.103
141.53%
Ranking of countries by current statistics by years


Comments: