Download This statistics in other country:
Timeline:
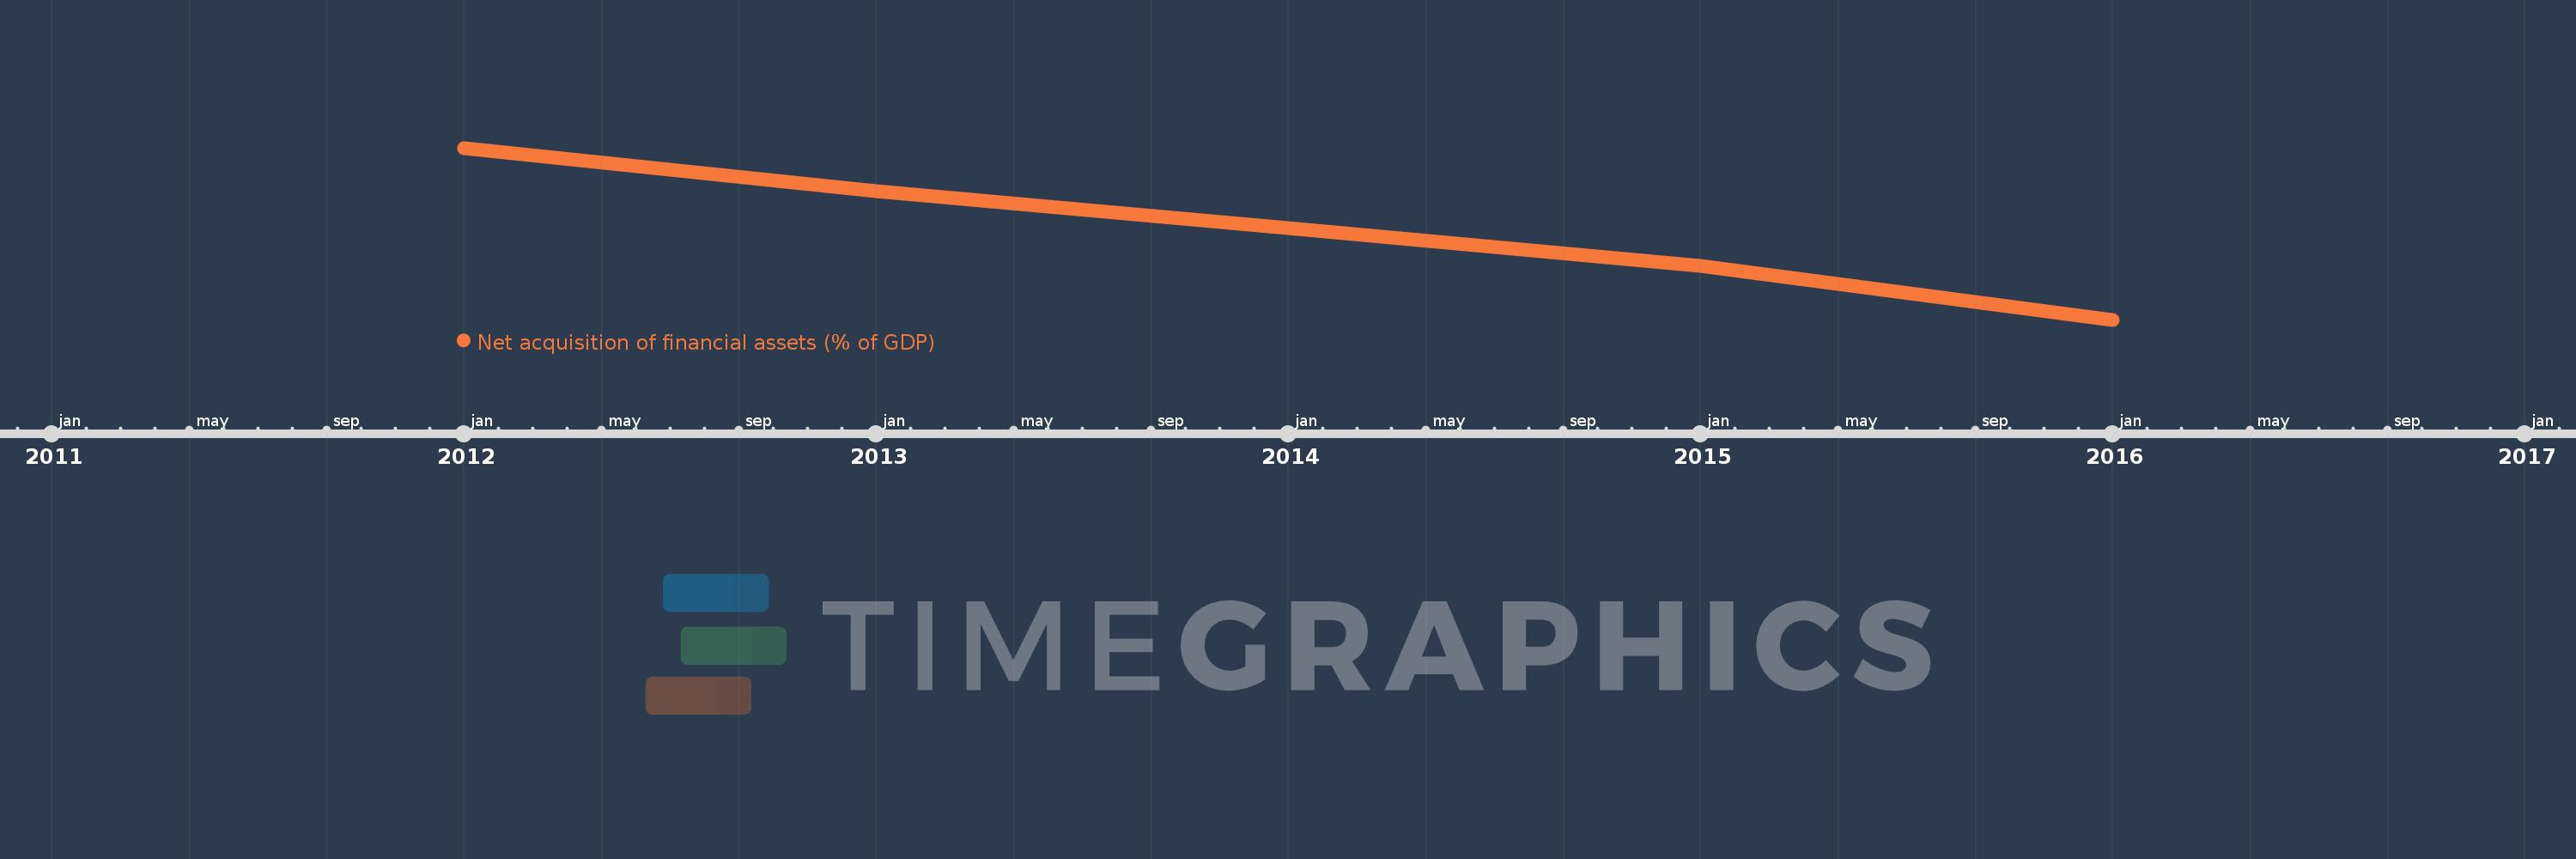
This timeline shows a graph from 2012 to 2016 of Solomon Islands. No data until 2011. Number of actual observations by date: 5.
Source name:
World Development Indicators
Source organization:
International Monetary Fund, Government Finance Statistics Yearbook and data files.
Categories, topics:
Public Sector
Last updated:
apr 23, 2017
Indicators value changes by year
Minimum:
-1.912
jan 1, 2016
At the date of observation
Value
Absolute change
Change from the previous value
jan 1, 2012
7.409
+7.409
0.0%
jan 1, 2013
5.081
-2.328
-31.42%
jan 1, 2014
3.066
-2.015
-39.66%
jan 1, 2015
1.03
-2.036
-66.42%
jan 1, 2016
-1.912
-2.941
-285.69%
Ranking of countries by current statistics by years
