29
/
en
AIzaSyAYiBZKx7MnpbEhh9jyipgxe19OcubqV5w
April 1, 2024
206672
Nepal
NPL
true
2
1
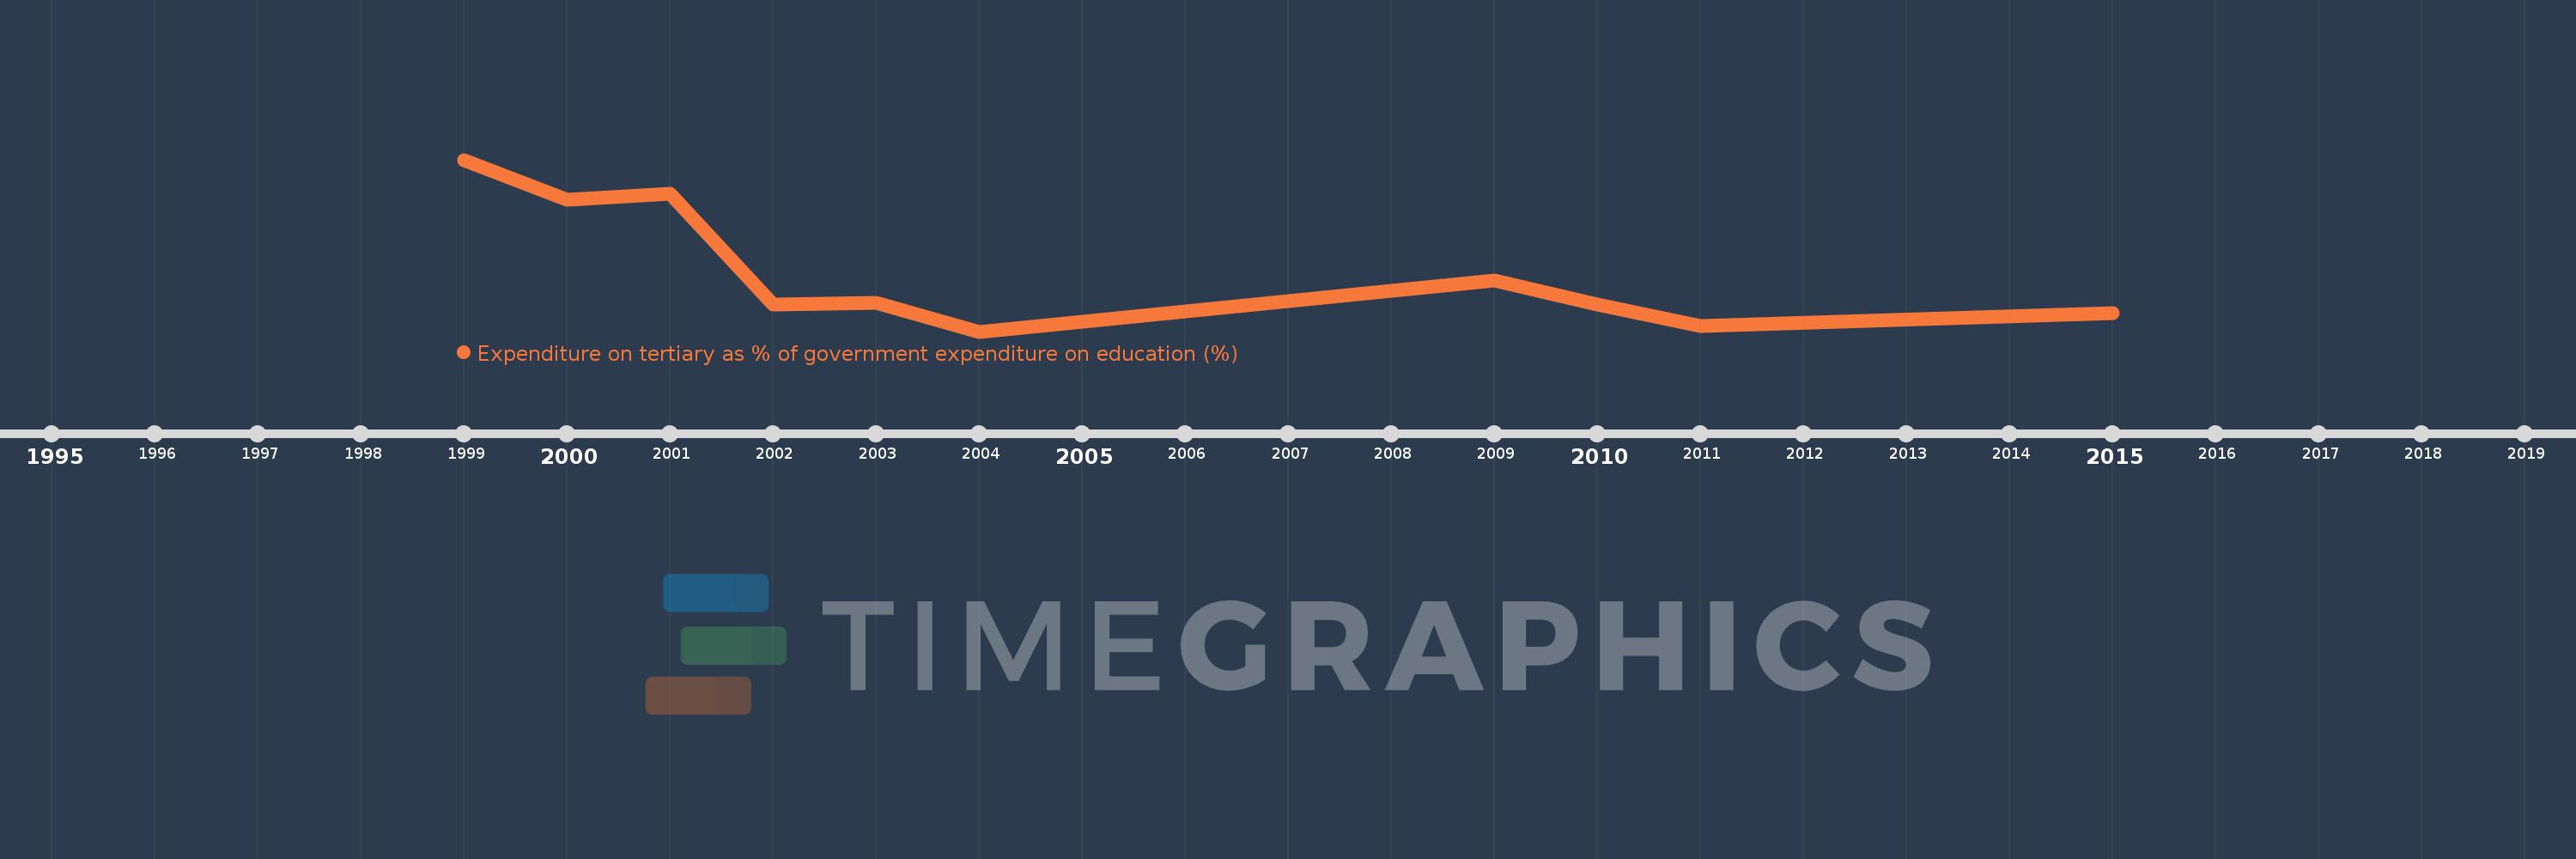
Expenditure on tertiary as % of government expenditure on education (%)
2015,2011,2010,2009,2004,2003,2002,2001,2000,1999
This statistics in other country:
Timeline:
This timeline shows a graph from 1999 to 2015 of Nepal. No data until 1998. Number of actual observations by date: 10.
Source name:
World Development Indicators
Source organization:
UNESCO Institute for Statistics
Categories, topics:
Education
Last updated:
apr 23, 2017
Indicators value changes by year
Minimum:
10.281
jan 1, 2004
Maximum:
20.955
jan 1, 1999
At the date of observation
Value
Absolute change
Change from previous value
jan 1, 1999
20.955
+20.955
0.0%
jan 1, 2000
18.45
-2.506
-11.96%
jan 1, 2001
18.822
+0.373
2.02%
jan 1, 2002
11.941
-6.882
-36.56%
jan 1, 2003
12.072
+0.131
1.1%
jan 1, 2004
10.281
-1.791
-14.83%
jan 1, 2009
13.458
+3.176
30.9%
jan 1, 2010
11.982
-1.475
-10.96%
jan 1, 2011
10.653
-1.33
-11.1%
jan 1, 2015
11.407
+0.755
7.08%
Ranking of countries by current statistics by years


Comments: