29
/
en
AIzaSyAYiBZKx7MnpbEhh9jyipgxe19OcubqV5w
April 1, 2024
58042
South Asia (IDA & IBRD)
TSA
false
2
1
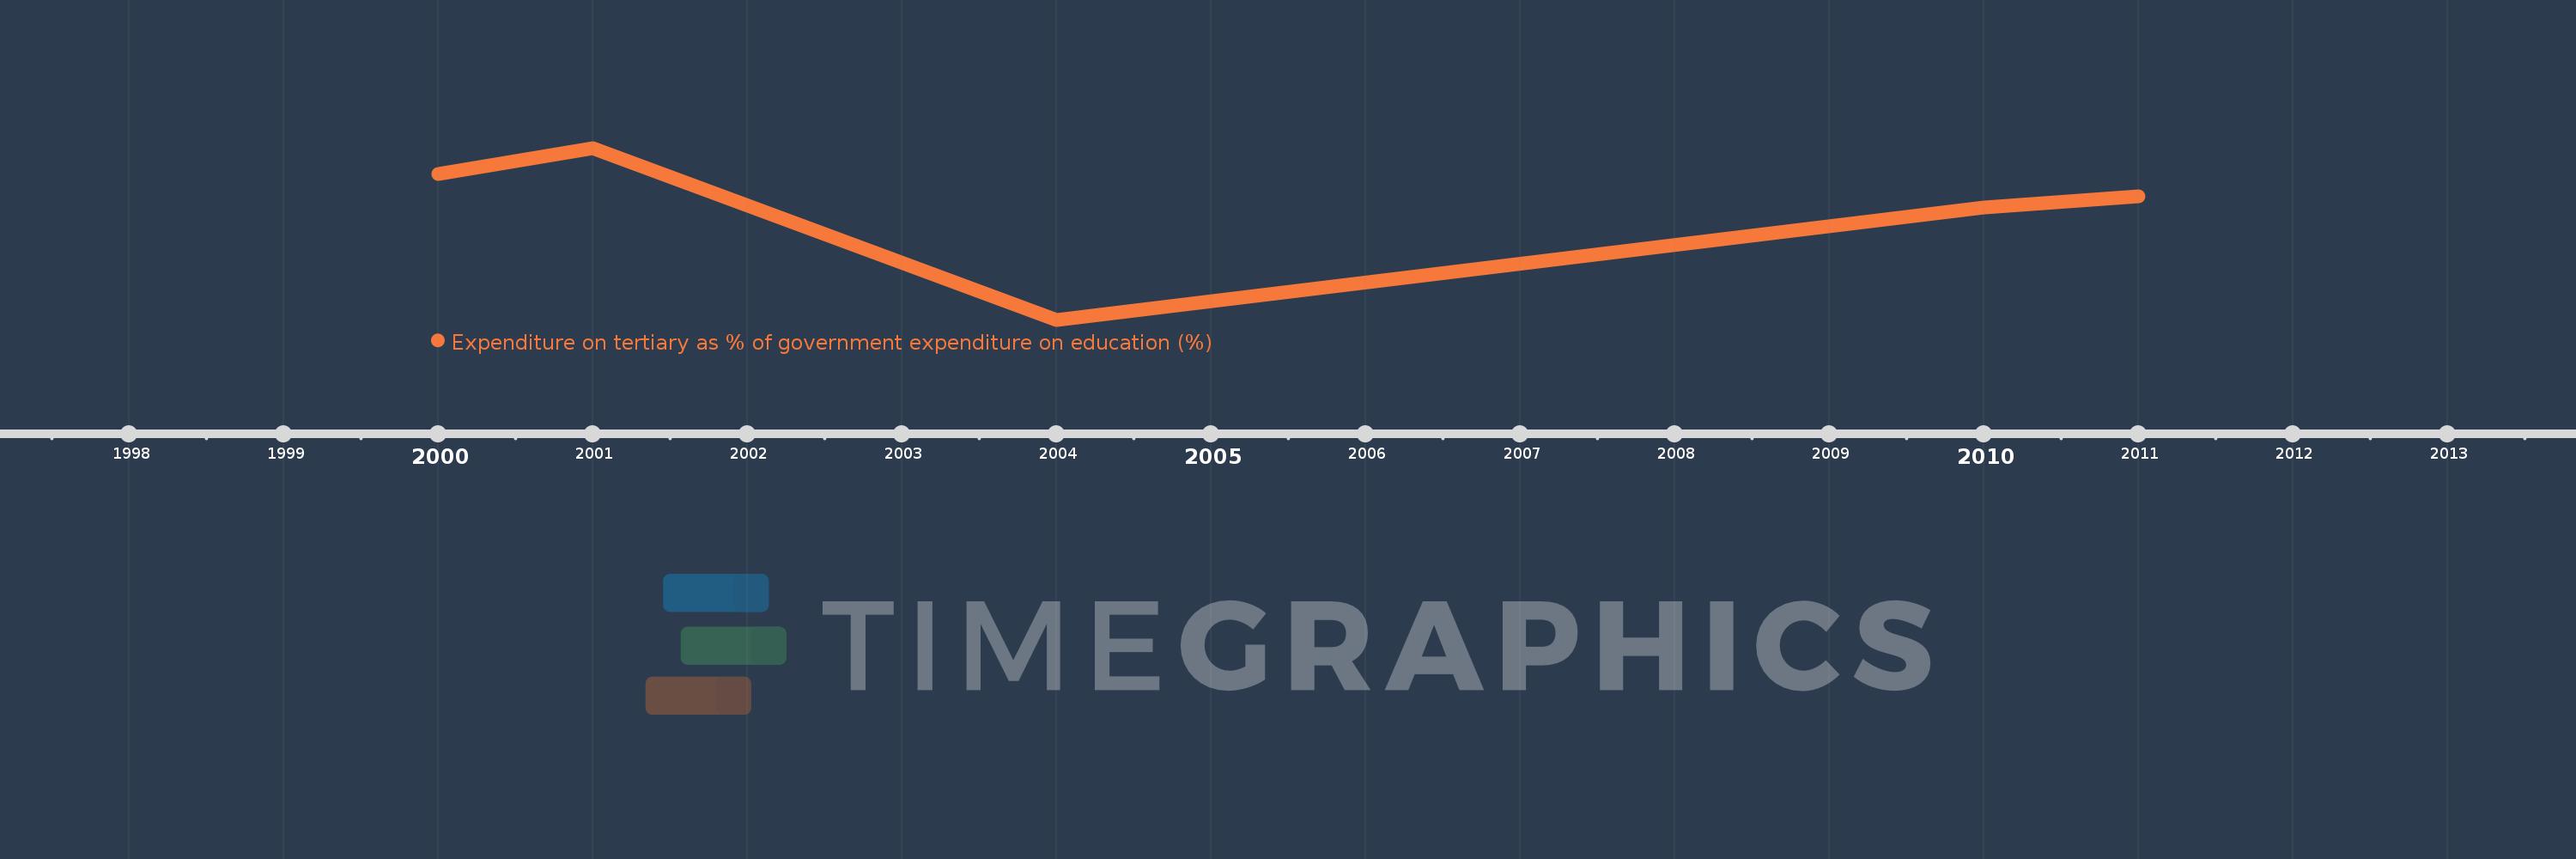
Expenditure on tertiary as % of government expenditure on education (%)
2011,2010,2004,2001,2000
This statistics in other country:
Timeline:
This timeline shows a graph from 2000 to 2011 of South Asia (IDA & IBRD). No data until 1999. Number of actual observations by date: 5.
Source name:
World Development Indicators
Source organization:
UNESCO Institute for Statistics
Categories, topics:
Education
Last updated:
apr 23, 2017
Indicators value changes by year
Minimum:
10.281
jan 1, 2004
Maximum:
18.822
jan 1, 2001
At the date of observation
Value
Absolute change
Change from previous value
jan 1, 2000
17.545
+17.545
0.0%
jan 1, 2001
18.822
+1.277
7.28%
jan 1, 2004
10.281
-8.541
-45.38%
jan 1, 2010
15.848
+5.567
54.15%
jan 1, 2011
16.428
+0.58
3.66%
Ranking of countries by current statistics by years


Comments: