29
/
en
AIzaSyAYiBZKx7MnpbEhh9jyipgxe19OcubqV5w
April 1, 2024
94785
Burkina Faso
BFA
true
2
1
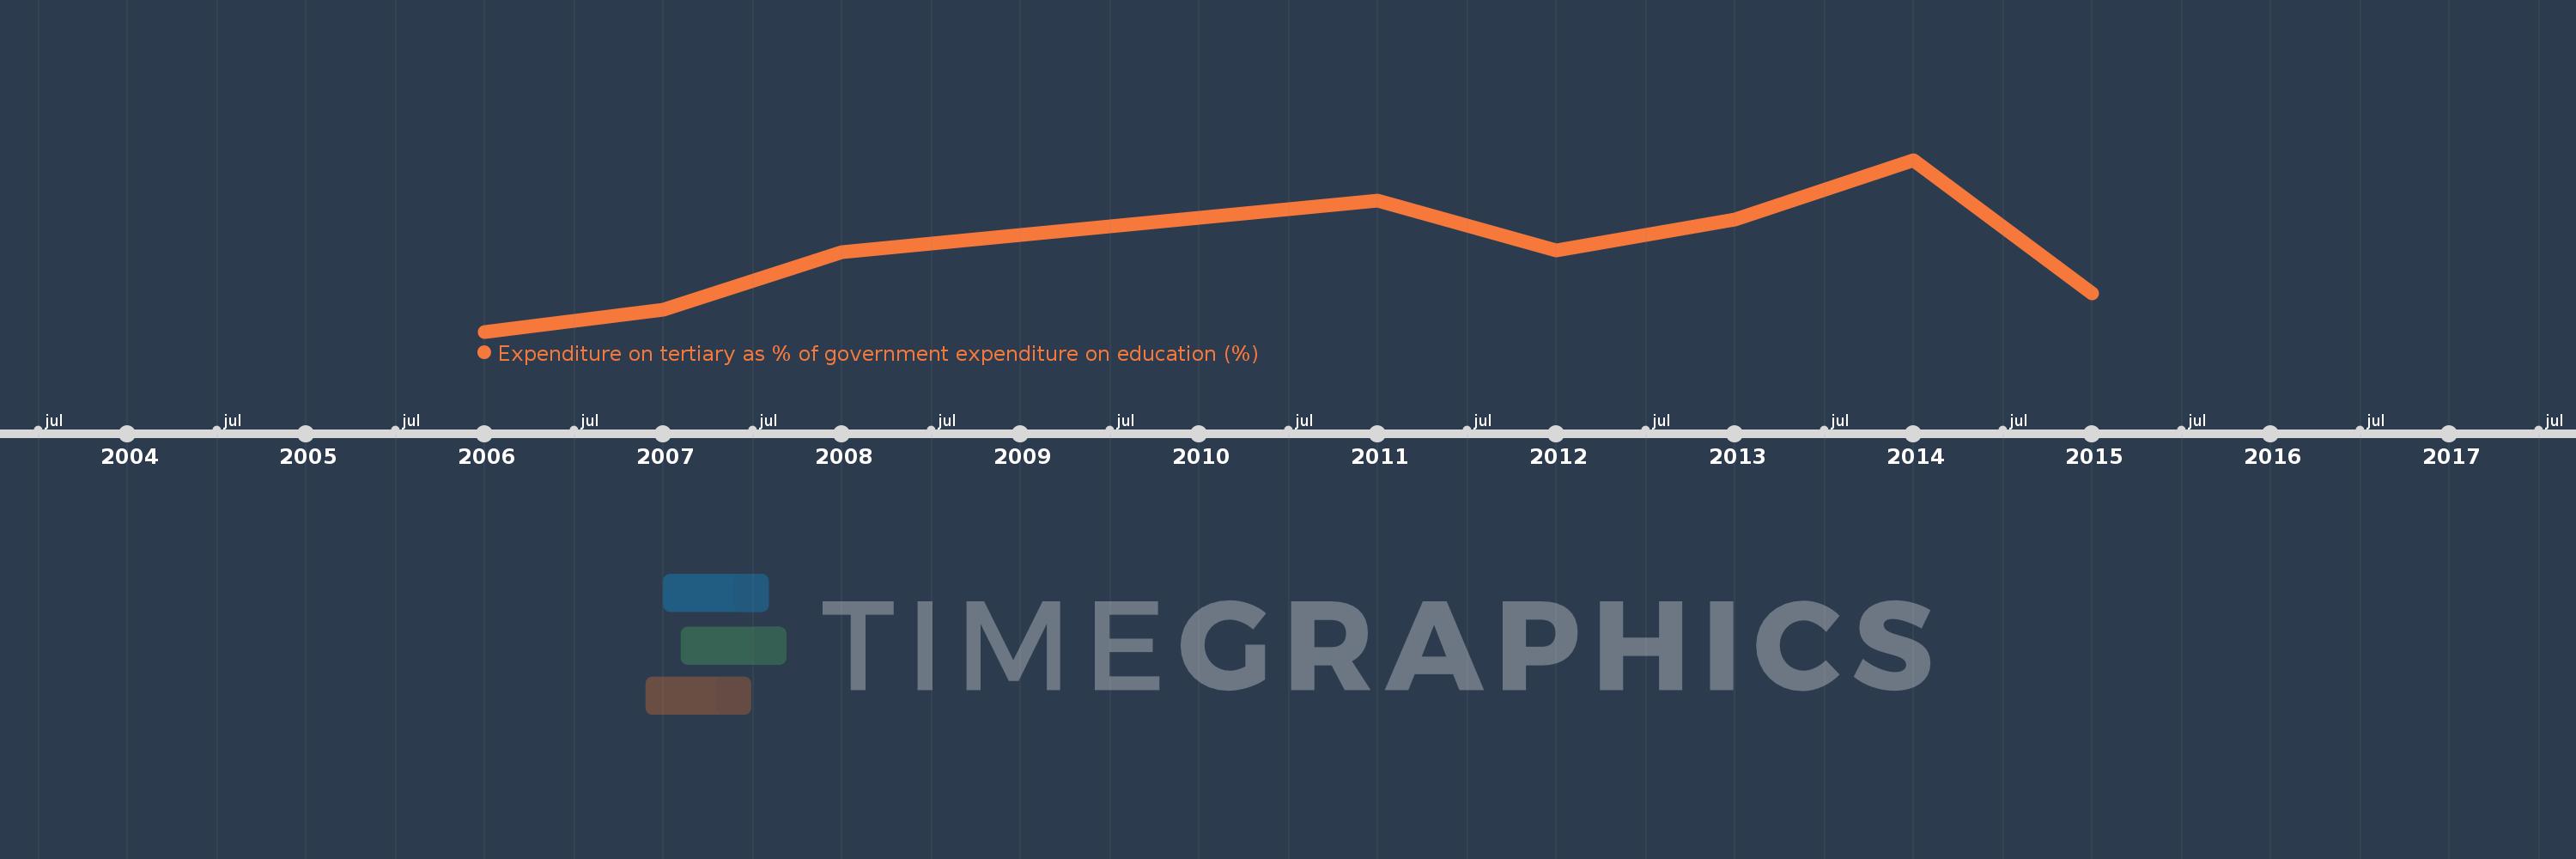
Expenditure on tertiary as % of government expenditure on education (%)
2015,2014,2013,2012,2011,2008,2007,2006
This statistics in other country:
Timeline:
This timeline shows a graph from 2006 to 2015 of Burkina Faso. No data until 2005. Number of actual observations by date: 8.
Source name:
World Development Indicators
Source organization:
UNESCO Institute for Statistics
Categories, topics:
Education
Last updated:
apr 23, 2017
Indicators value changes by year
Maximum:
21.718
jan 1, 2014
At the date of observation
Value
Absolute change
Change from previous value
jan 1, 2006
9.575
+9.575
0.0%
jan 1, 2007
11.12
+1.545
16.13%
jan 1, 2008
15.202
+4.082
36.71%
jan 1, 2011
18.841
+3.639
23.94%
jan 1, 2012
15.312
-3.529
-18.73%
jan 1, 2013
17.501
+2.189
14.3%
jan 1, 2014
21.718
+4.217
24.1%
jan 1, 2015
12.289
-9.429
-43.41%
Ranking of countries by current statistics by years


Comments: