29
/
en
AIzaSyAYiBZKx7MnpbEhh9jyipgxe19OcubqV5w
April 1, 2024
96038
Burundi
BDI
true
2
1
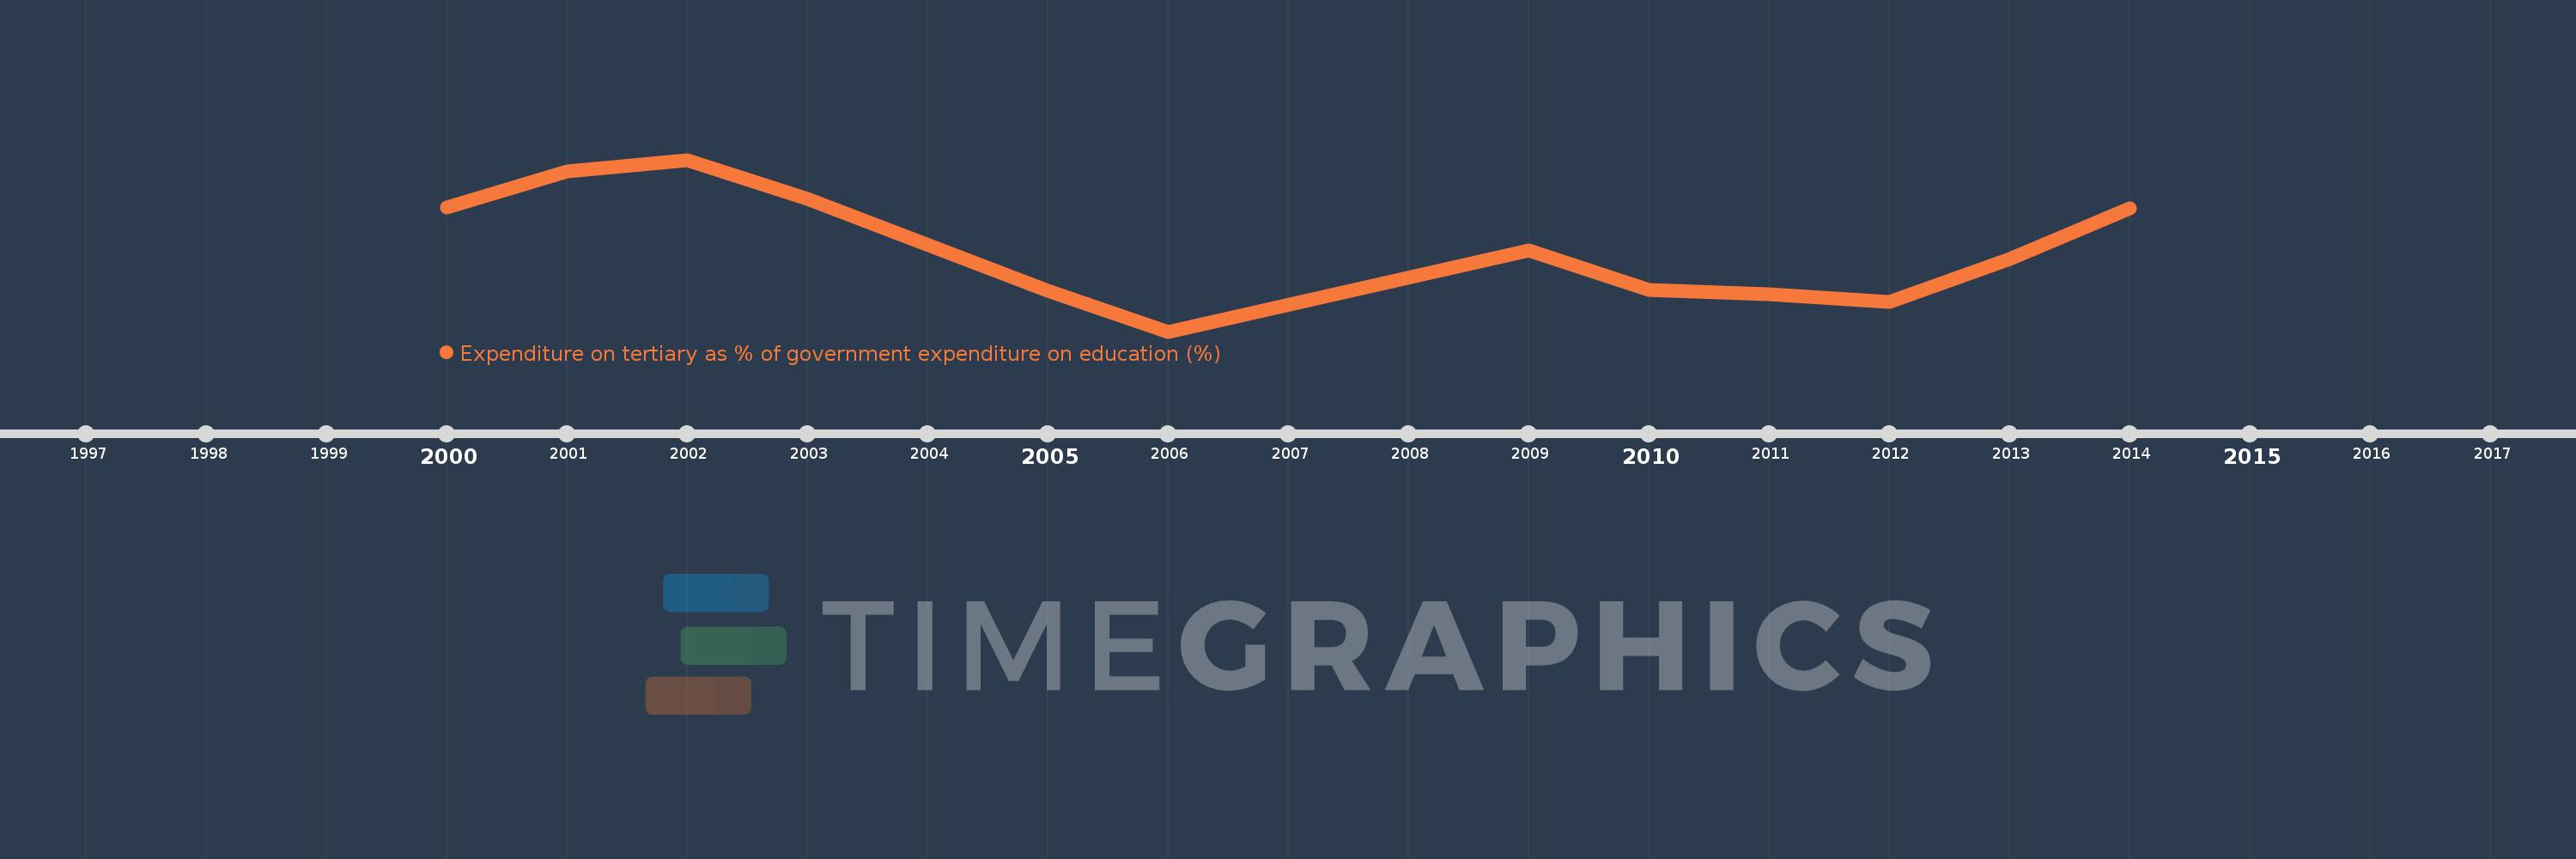
Expenditure on tertiary as % of government expenditure on education (%)
2014,2013,2012,2011,2010,2009,2006,2005,2003,2002,2001,2000
This statistics in other country:
Timeline:
This timeline shows a graph from 2000 to 2014 of Burundi. No data until 1999. Number of actual observations by date: 12.
Source name:
World Development Indicators
Source organization:
UNESCO Institute for Statistics
Categories, topics:
Education
Last updated:
apr 23, 2017
Indicators value changes by year
Minimum:
15.308
jan 1, 2006
Maximum:
27.766
jan 1, 2002
At the date of observation
Value
Absolute change
Change from previous value
jan 1, 2000
24.304
+24.304
0.0%
jan 1, 2001
26.925
+2.621
10.78%
jan 1, 2002
27.766
+0.842
3.13%
jan 1, 2003
24.932
-2.835
-10.21%
jan 1, 2005
18.283
-6.649
-26.67%
jan 1, 2006
15.308
-2.975
-16.27%
jan 1, 2009
21.21
+5.902
38.56%
jan 1, 2010
18.346
-2.864
-13.5%
jan 1, 2011
18.034
-0.312
-1.7%
jan 1, 2012
17.46
-0.574
-3.18%
jan 1, 2013
20.579
+3.119
17.87%
jan 1, 2014
24.234
+3.655
17.76%
Ranking of countries by current statistics by years


Comments: