29
/
en
AIzaSyAYiBZKx7MnpbEhh9jyipgxe19OcubqV5w
April 1, 2024
35690
High income
HIC
false
2
1
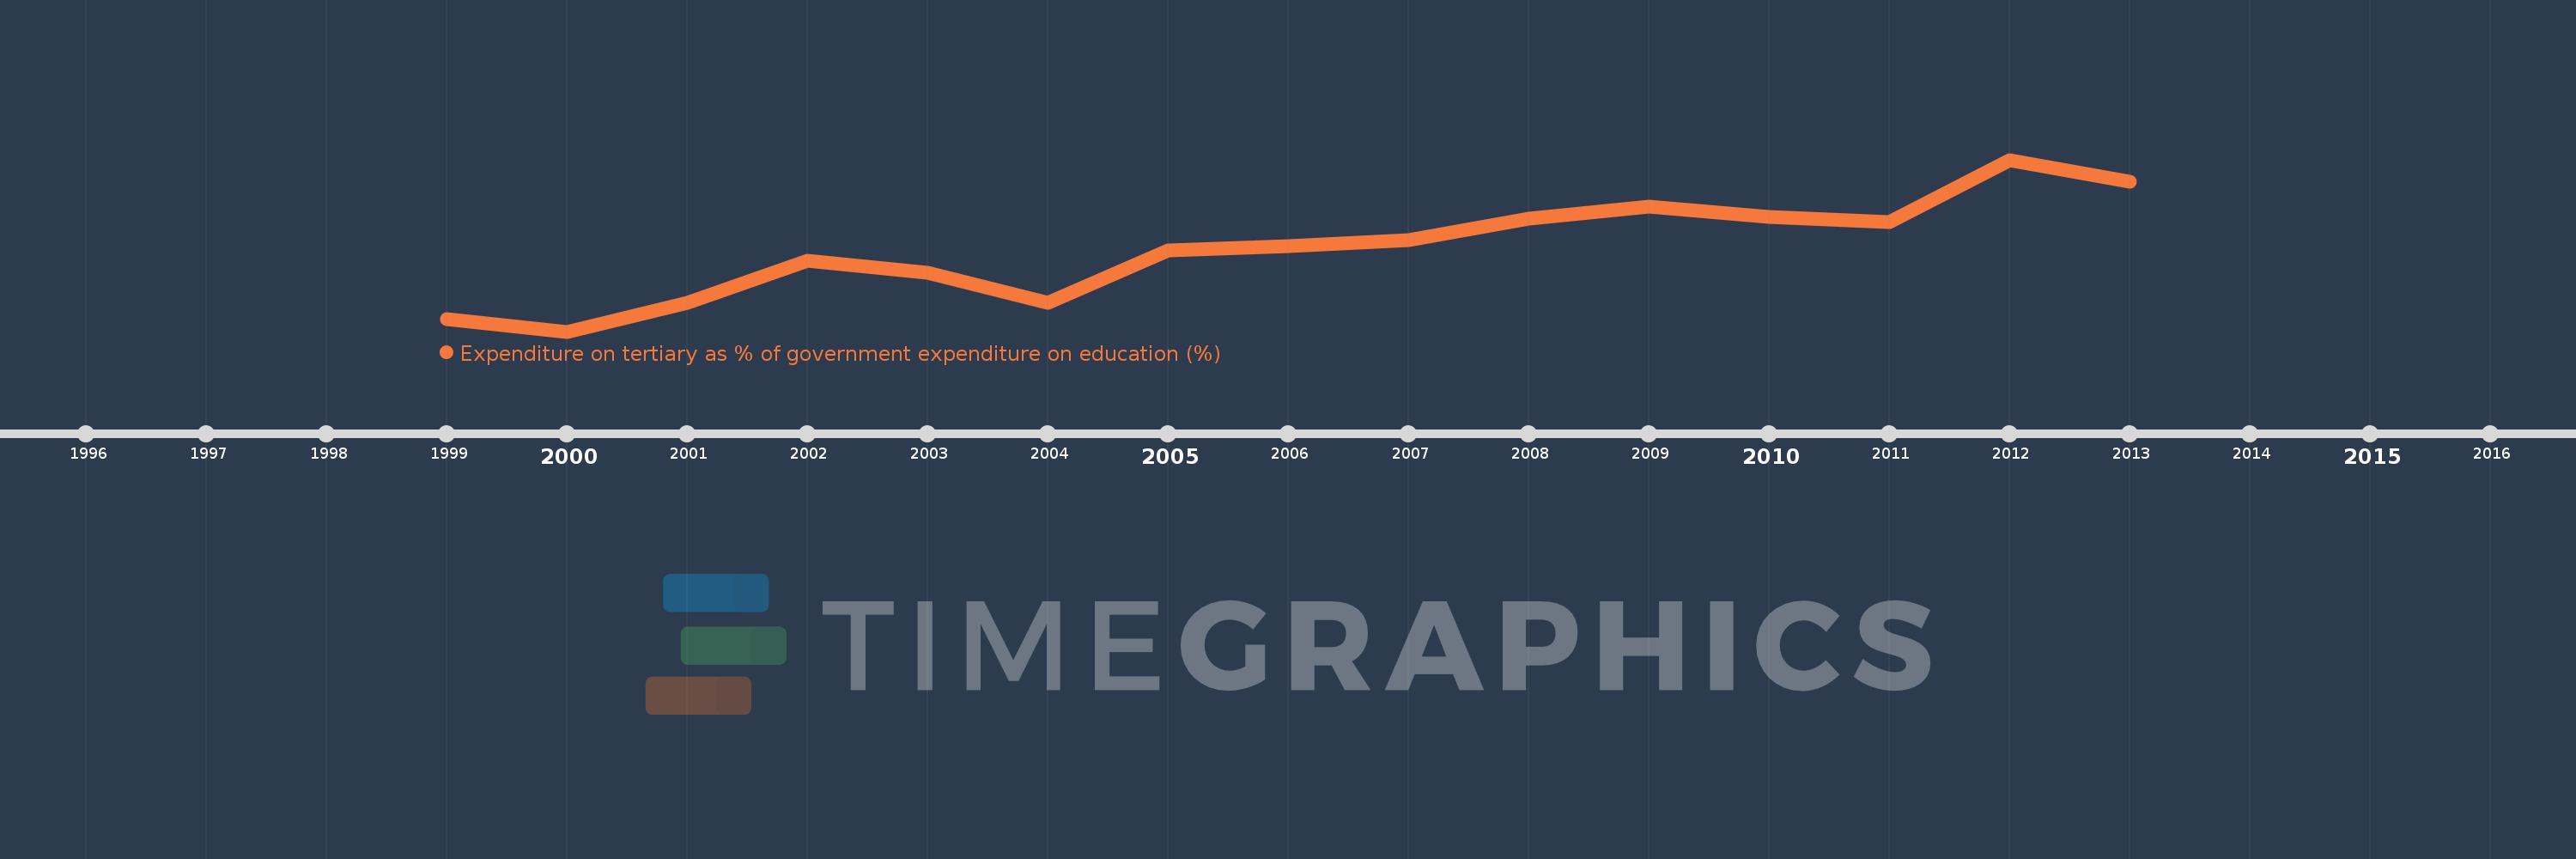
Expenditure on tertiary as % of government expenditure on education (%)
2013,2012,2011,2010,2009,2008,2007,2006,2005,2004,2003,2002,2001,2000,1999
This statistics in other country:
Timeline:
This timeline shows a graph from 1999 to 2013 of High income. No data until 1998. Number of actual observations by date: 15.
Source name:
World Development Indicators
Source organization:
UNESCO Institute for Statistics
Categories, topics:
Education
Last updated:
apr 23, 2017
Indicators value changes by year
Minimum:
20.054
jan 1, 2000
At the date of observation
Value
Absolute change
Change from previous value
jan 1, 1999
20.345
+20.345
0.0%
jan 1, 2000
20.054
-0.291
-1.43%
jan 1, 2001
20.749
+0.695
3.46%
jan 1, 2002
21.76
+1.011
4.87%
jan 1, 2003
21.474
-0.286
-1.31%
jan 1, 2004
20.754
-0.719
-3.35%
jan 1, 2005
22.018
+1.264
6.09%
jan 1, 2006
22.111
+0.093
0.42%
jan 1, 2007
22.253
+0.142
0.64%
jan 1, 2008
22.771
+0.518
2.33%
jan 1, 2009
23.08
+0.309
1.36%
jan 1, 2010
22.829
-0.251
-1.09%
jan 1, 2011
22.701
-0.128
-0.56%
jan 1, 2012
24.2
+1.498
6.6%
jan 1, 2013
23.679
-0.521
-2.15%
Ranking of countries by current statistics by years


Comments: