29
/
en
AIzaSyAYiBZKx7MnpbEhh9jyipgxe19OcubqV5w
April 1, 2024
72174
Aruba
ABW
true
2
1
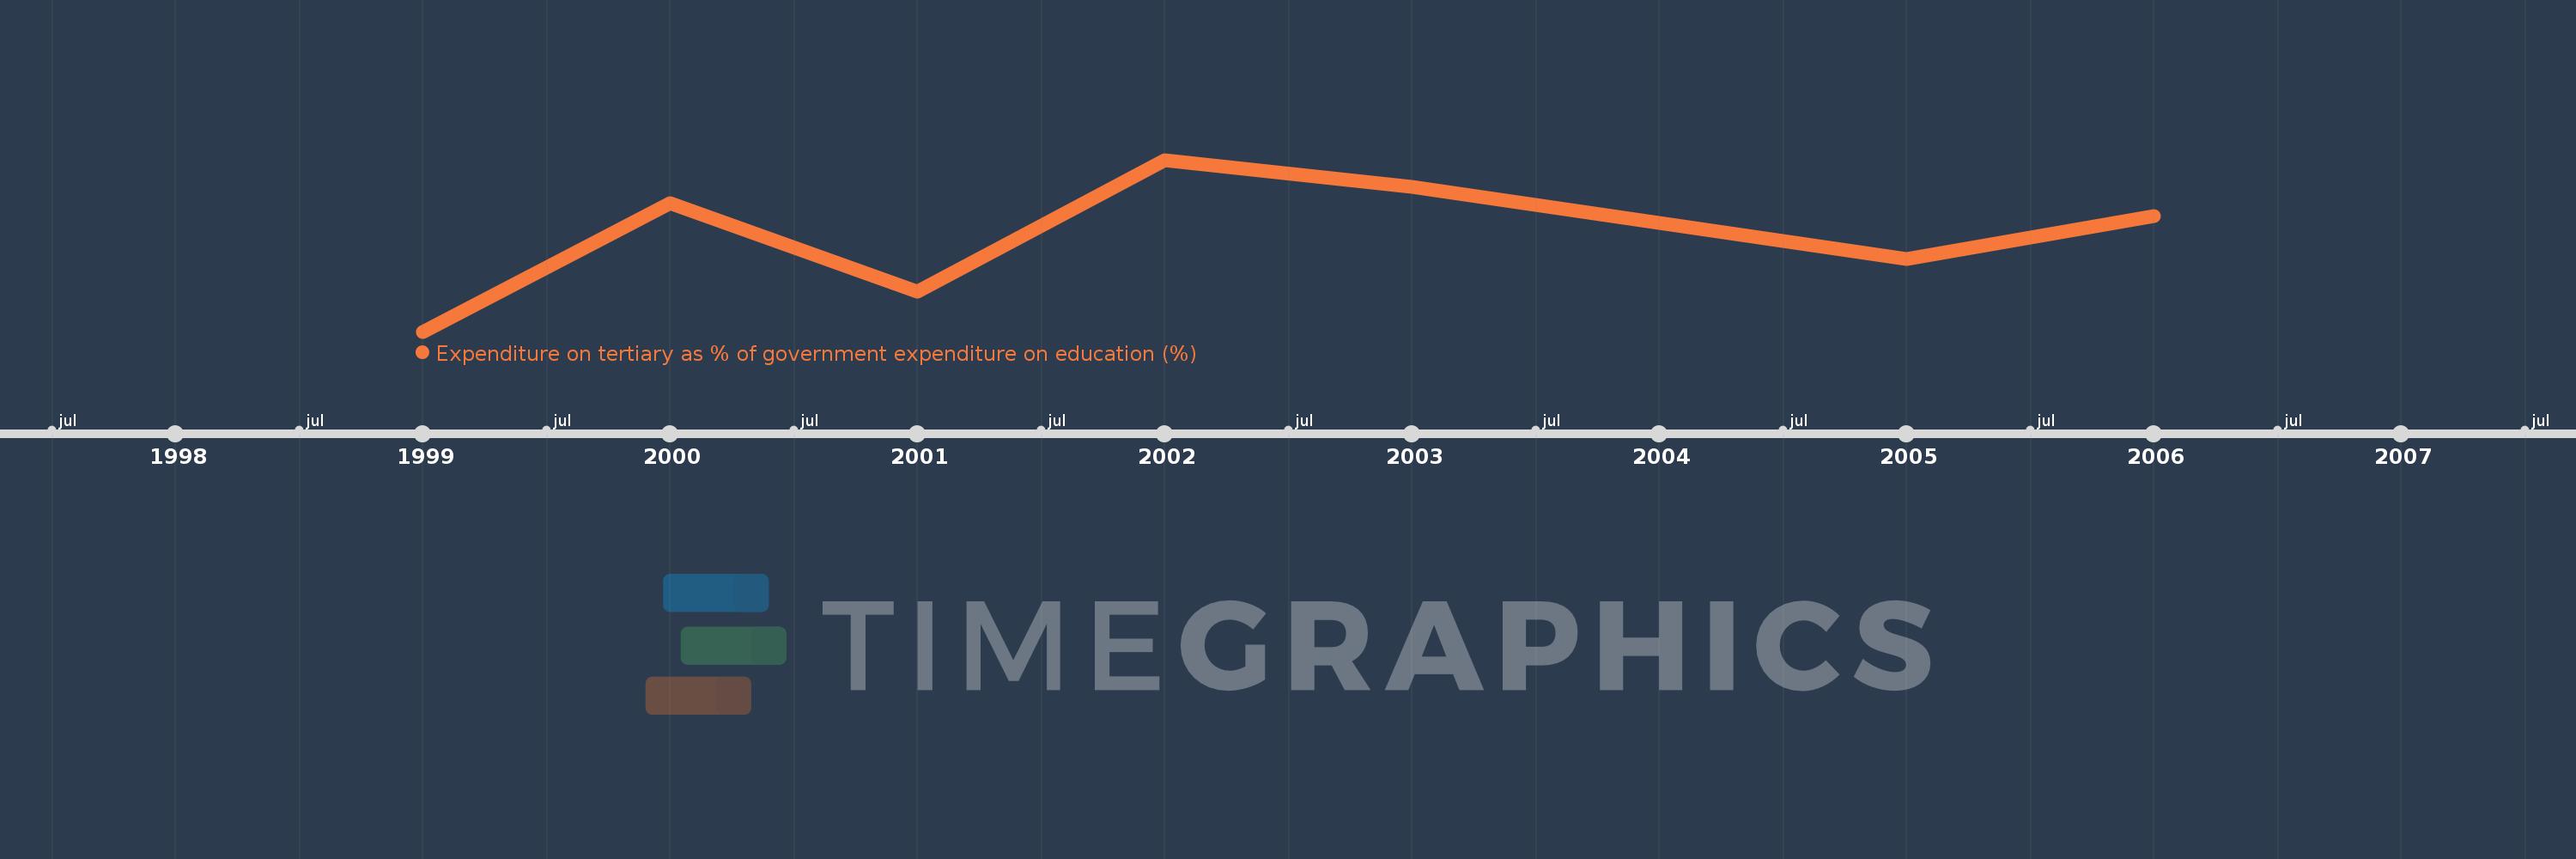
Expenditure on tertiary as % of government expenditure on education (%)
2006,2005,2003,2002,2001,2000,1999
This statistics in other country:
Timeline:
This timeline shows a graph from 1999 to 2006 of Aruba. No data until 1998. Number of actual observations by date: 7.
Source name:
World Development Indicators
Source organization:
UNESCO Institute for Statistics
Categories, topics:
Education
Last updated:
apr 23, 2017
Indicators value changes by year
Minimum:
10.102
jan 1, 1999
Maximum:
12.162
jan 1, 2002
At the date of observation
Value
Absolute change
Change from previous value
jan 1, 1999
10.102
+10.102
0.0%
jan 1, 2000
11.639
+1.537
15.22%
jan 1, 2001
10.585
-1.054
-9.06%
jan 1, 2002
12.162
+1.577
14.9%
jan 1, 2003
11.84
-0.322
-2.65%
jan 1, 2005
10.971
-0.869
-7.34%
jan 1, 2006
11.485
+0.514
4.69%
Ranking of countries by current statistics by years


Comments: