29
/
en
AIzaSyAYiBZKx7MnpbEhh9jyipgxe19OcubqV5w
April 1, 2024
33383
European Union
EUU
false
2
1
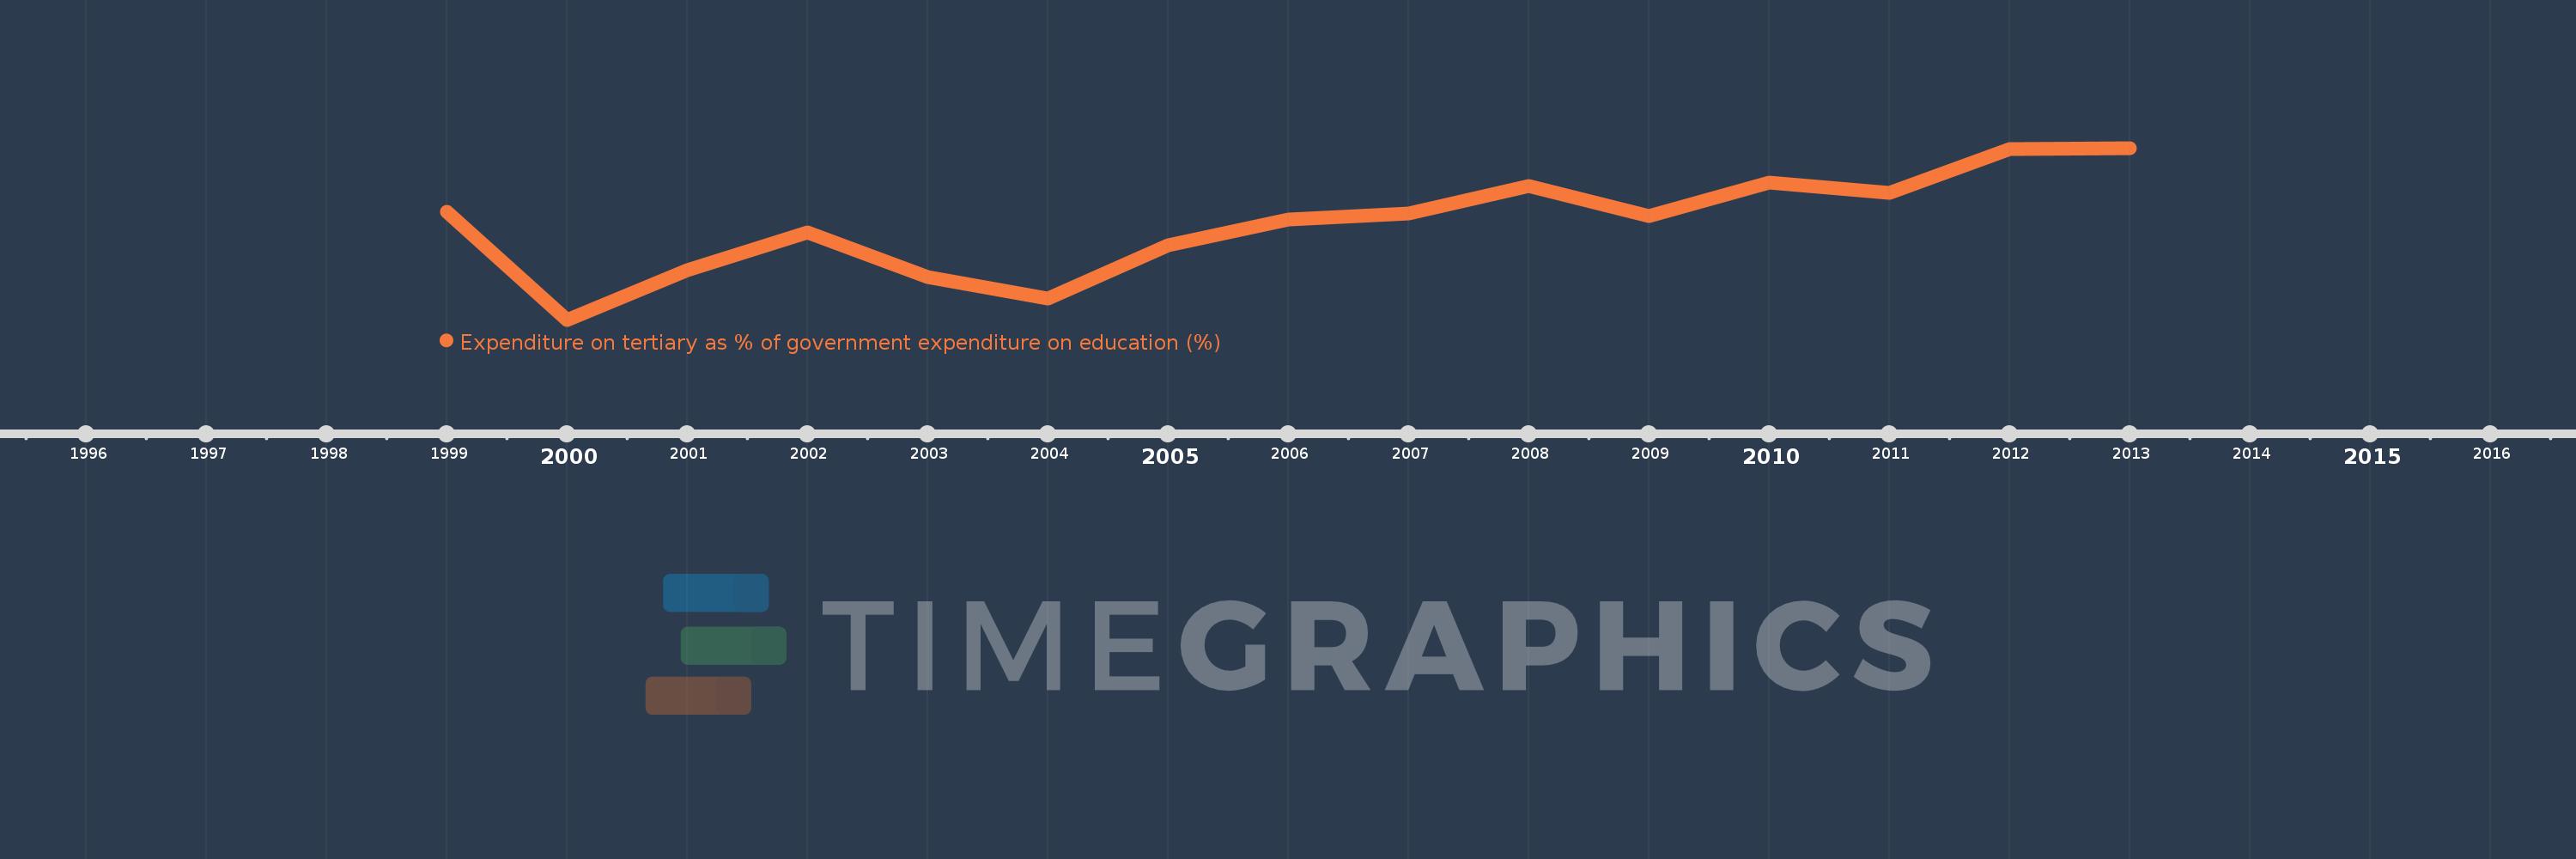
Expenditure on tertiary as % of government expenditure on education (%)
2013,2012,2011,2010,2009,2008,2007,2006,2005,2004,2003,2002,2001,2000,1999
This statistics in other country:
Timeline:
This timeline shows a graph from 1999 to 2013 of European Union. No data until 1998. Number of actual observations by date: 15.
Source name:
World Development Indicators
Source organization:
UNESCO Institute for Statistics
Categories, topics:
Education
Last updated:
apr 23, 2017
Indicators value changes by year
Minimum:
20.054
jan 1, 2000
Maximum:
23.421
jan 1, 2013
At the date of observation
Value
Absolute change
Change from previous value
jan 1, 1999
22.173
+22.173
0.0%
jan 1, 2000
20.054
-2.119
-9.56%
jan 1, 2001
21.02
+0.966
4.82%
jan 1, 2002
21.76
+0.74
3.52%
jan 1, 2003
20.894
-0.865
-3.98%
jan 1, 2004
20.477
-0.417
-2.0%
jan 1, 2005
21.507
+1.029
5.03%
jan 1, 2006
22.027
+0.52
2.42%
jan 1, 2007
22.144
+0.117
0.53%
jan 1, 2008
22.678
+0.534
2.41%
jan 1, 2009
22.079
-0.599
-2.64%
jan 1, 2010
22.744
+0.665
3.01%
jan 1, 2011
22.534
-0.21
-0.92%
jan 1, 2012
23.393
+0.858
3.81%
jan 1, 2013
23.421
+0.029
0.12%
Ranking of countries by current statistics by years


Comments: