29
/
en
AIzaSyAYiBZKx7MnpbEhh9jyipgxe19OcubqV5w
April 1, 2024
40659
Late-demographic dividend
LTE
false
2
1
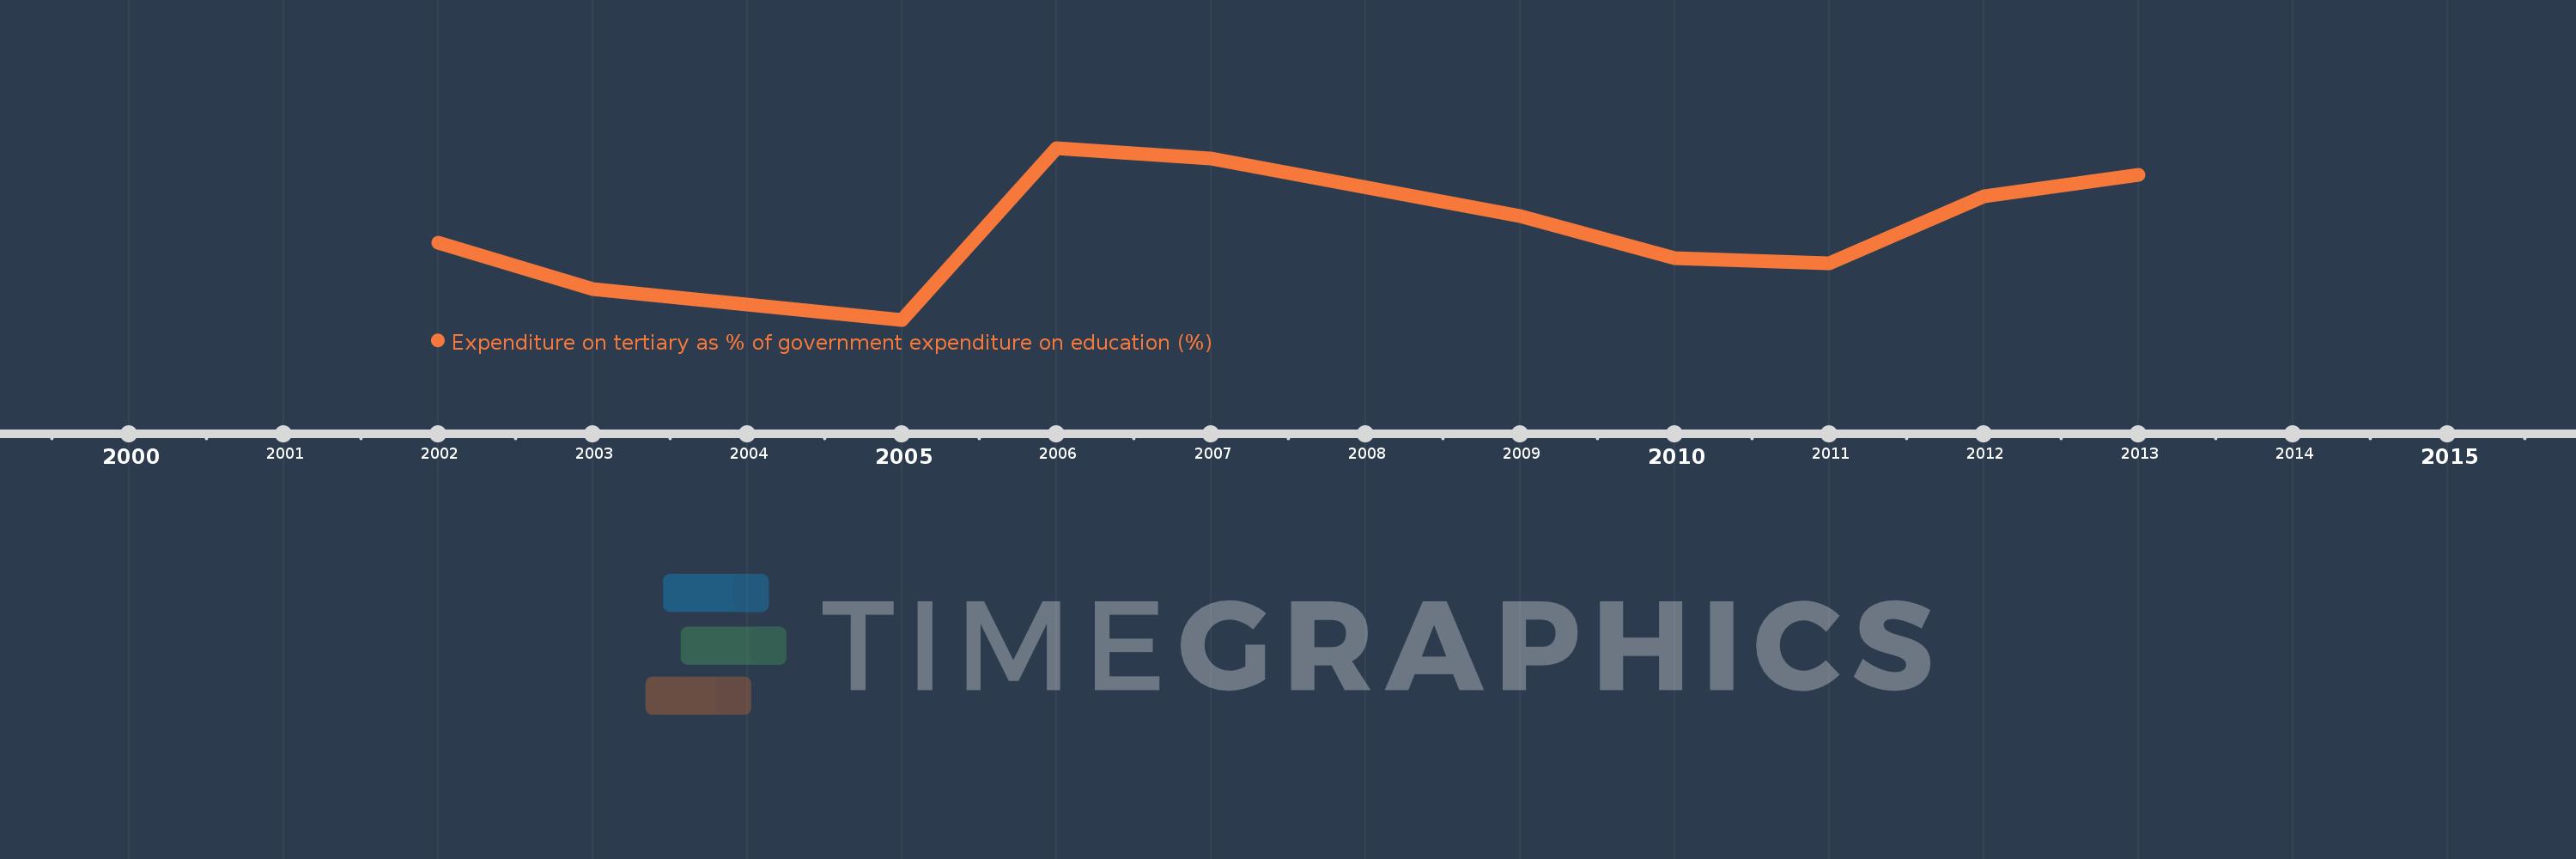
Expenditure on tertiary as % of government expenditure on education (%)
2013,2012,2011,2010,2009,2007,2006,2005,2003,2002
This statistics in other country:
Timeline:
This timeline shows a graph from 2002 to 2013 of Late-demographic dividend. No data until 2001. Number of actual observations by date: 10.
Source name:
World Development Indicators
Source organization:
UNESCO Institute for Statistics
Categories, topics:
Education
Last updated:
apr 23, 2017
Indicators value changes by year
Maximum:
21.056
jan 1, 2006
At the date of observation
Value
Absolute change
Change from previous value
jan 1, 2002
19.875
+19.875
0.0%
jan 1, 2003
19.305
-0.569
-2.87%
jan 1, 2005
18.92
-0.385
-1.99%
jan 1, 2006
21.056
+2.136
11.29%
jan 1, 2007
20.927
-0.129
-0.61%
jan 1, 2009
20.208
-0.72
-3.44%
jan 1, 2010
19.688
-0.52
-2.57%
jan 1, 2011
19.626
-0.062
-0.31%
jan 1, 2012
20.459
+0.833
4.24%
jan 1, 2013
20.723
+0.265
1.29%
Ranking of countries by current statistics by years


Comments: